Philippines - Foreign trade
Between 1996, exports surged from $20.5 billion to $38.1 billion. Imports peaked in 1997 at $38.6 billion, but by 2000 had dropped to $33.8 billion. The 1999 and 2000 trade surpluses were the first since 1973; during the intervening period, expensive mineral fuel imports had thrown the balance into a deficit.
The Philippines' traditional exports were primary commodities and raw materials. However, by 2000, machinery and transport equipment made up the majority of exports. In 2000, exports of electric machinery (mostly microcircuits, diodes, and transistors) accounted for 51% of total exports, and garments contributed6.8% to the total value of exports. In 2000, the Philippines exported a majority of electronics, including microcircuits, transistors and valves (44%); automatic data processing equipment (12.2%); and telecommunications equipment (2.7%). Other exports included garments (6.8%), vegetable oil (1.2%), and fruits and nuts (1.1%). The Philippines account for 6.6% of the world's soft vegetable oil exports. In 2000, machinery and electronics accounted for over three-fourths of all exports.
In 2000 the Philippines' imports were distributed among the following categories:
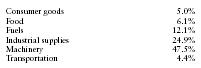
| Consumer goods | 5.0% |
| Food | 6.1% |
| Fuels | 12.1% |
| Industrial supplies | 24.9% |
| Machinery | 47.5% |
| Transportation | 4.4% |
The US and Japan continue to be the Philippines' primary trading partners. Principal trading partners in 2000 (in millions of US dollars) were as follows:
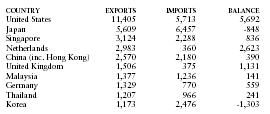
| COUNTRY | EXPORTS | IMPORTS | BALANCE |
| United States | 11,405 | 5,713 | 5,692 |
| Japan | 5,609 | 6,457 | -848 |
| Singapore | 3,124 | 2,288 | 836 |
| Netherlands | 2,983 | 360 | 2,623 |
| China (inc. Hong Kong) | 2,570 | 2,180 | 390 |
| United Kingdom | 1,506 | 375 | 1,131 |
| Malaysia | 1,377 | 1,236 | 141 |
| Germany | 1,329 | 770 | 559 |
| Thailand | 1,207 | 966 | 241 |
| Korea | 1,173 | 2,476 | -1,303 |
Please give me information about the latest Philippine Foreign Trade. Graphs and other articles will do so I can I an Information in my research study.
Thank you a lot, the information I can get for you will relly help for the success of my reasearch study.