Denmark - Foreign trade
The Danish economy depends heavily on foreign trade. Raw materials for use in production used to account for more than half the value of imports, but have seen a considerable decline in recent years. Farm products traditionally comprised the bulk of total Danish exports, but since 1961, industrial exports have exceeded agricultural exports in value. In 2000, industrial products accounted for 88.8% of Denmark's total commodity exports by value; agricultural and fishing exports accounted for 6.2%.
To curb domestic demand, the government introduced several fiscal restraint measures in 1986, resulting in a decline in imports. Such measures and a tight-money policy have curbed inflation and made Danish exports more competitive, leading to a trade surplus in every year from 1987 to 2000. In 2000, total exports were $49.2 billion and imports were $44.6 billion.
A great producer of food, Denmark's commodity exports include meat (6.8%), fresh fish (1.8%), and cheese (1.7%), each of which command a substantial percentage of the world's food exports in their categories (6.9%, 4.4%, and 8.7% respectively). The country also exports fine furniture (4.0%) and medicaments (4.3%).
In 2000 Denmark's imports were distributed among the following categories:

| Consumer goods | 19.1% |
| Food | 9.5% |
| Fuels | 5.8% |
| Industrial supplies | 26.9% |
| Machinery | 25.5% |
| Transportation | 10.1% |
| Other | 3.1% |
Principal trading partners in 2000 (in millions of US dollars) were as follows:
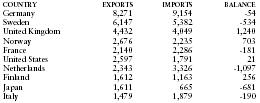
| COUNTRY | EXPORTS | IMPORTS | BALANCE |
| Germany | 8,271 | 9,154 | -54 |
| Sweden | 6,147 | 5,382 | -534 |
| United Kingdom | 4,432 | 4,049 | 1,240 |
| Norway | 2,676 | 2,235 | 703 |
| France | 2,140 | 2,286 | -181 |
| United States | 2,597 | 1,791 | 21 |
| Netherlands | 2,343 | 3,326 | -1,097 |
| Finland | 1,612 | 1,163 | 256 |
| Japan | 1,611 | 665 | -681 |
| Italy | 1,479 | 1,879 | -190 |