Pakistan - Foreign trade
Pakistan has suffered a weak trade position since the early 1970s, as the cost of oil imports have risen while prices for the country's main exports have declined on the international market. Exports fell 2.5% and imports dropped 20% in 1998, but by 2000 they were back on the upswing, growing at 8.3% and 19%, respectively. Pakistan's commerce ministry estimates that up to $1.5 billion of unregistered trade occurs annually, mostly from smuggled imports.
The important commodity exports for Pakistan are cotton, textiles, and clothes. Other major exports include rice and leather. The following chart shows the top 10 exports:
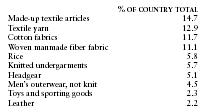
| % OF COUNTRY TOTAL | |
| Made-up textile articles | 14.7 |
| Textile yarn | 12.9 |
| Cotton fabrics | 11.7 |
| Woven manmade fiber fabric | 11.1 |
| Rice | 5.8 |
| Knitted undergarments | 5.7 |
| Headgear | 5.1 |
| Men's outerwear, not knit | 4.5 |
| Toys and sporting goods | 2.3 |
| Leather 2.2 |
In 2000 Pakistan's imports were distributed among the following categories:
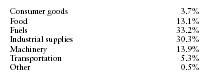
| Consumer goods | 3.7% |
| Food | 13.1% |
| Fuels | 33.2% |
| Industrial supplies | 30.3% |
| Machinery | 13.9% |
| Transportation | 5.3% |
| Other | 0.5% |
Smuggled goods (tea, soap, domestic appliances, batteries, tires, bicycles, and televisions) enter the country primarily from Afghanistan.
During the 1980s, the United Kingdom, traditionally Pakistan's most important trading partner, slipped behind the United States, Japan, and Germany. Principal trading partners in 2000 (in millions of US dollars) were as follows:
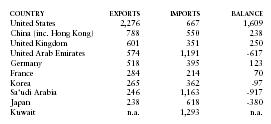
| COUNTRY | EXPORTS | IMPORTS | BALANCE |
| United States | 2,276 | 667 | 1,609 |
| China (inc. Hong Kong) | 788 | 550 | 238 |
| United Kingdom | 601 | 351 | 250 |
| United Arab Emirates | 574 | 1,191 | -617 |
| Germany | 518 | 395 | 123 |
| France | 284 | 214 | 70 |
| Korea | 265 | 362 | -97 |
| Sa'udi Arabia | 246 | 1,163 | -917 |
| Japan | 238 | 618 | -380 |
| Kuwait | n.a. | 1,293 | n.a. |