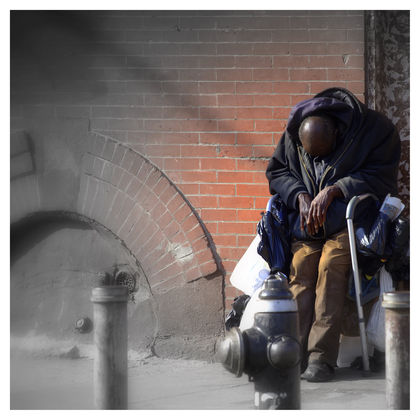
United States of America - Poverty and wealth

Income distribution in the United States has remained relatively constant since World War II, but by the 1990s the wealthiest groups had gained a larger share of the nation's wealth. In 1950, the richest 20 percent of Americans controlled 42.8 percent of wealth, the middle 20 percent controlled 17.4 percent, and the poorest controlled just 4.5 percent. By 1980, the wealthiest group controlled 41.6 percent, the middle group 17.5 percent, and the poorest 5.1 percent. However, by 1998, the poor and middle groups had lost some ground to the wealthy. The richest group controlled 49.2 percent of wealth, the middle group just 15 percent, and the poor just 3.6 percent. That same year the richest 5 percent of the population controlled 21.4 percent of wealth. The trend toward the greater concentration of wealth by the rich has accelerated throughout the 1990s. While the relative income of the poorest families in the United States declined by 11.6 percent since 1980, the income of the richest group increased by 17.7 percent.
The United States has a high standard of living and ranks number 3 in the world in human development according
| GDP per Capita (US$) | |||||
| Country | 1975 | 1980 | 1985 | 1990 | 1998 |
| United States | 19,364 | 21,529 | 23,200 | 25,363 | 29,683 |
| Canada | 14,535 | 16,423 | 17,850 | 19,160 | 20,458 |
| Japan | 23,296 | 27,672 | 31,588 | 38,713 | 42,081 |
| Germany | N/A | N/A | N/A | N/A | 31,141 |
| SOURCE: United Nations. Human Development Report 2000; Trends in human development and per capita income. | |||||
| Distribution of Income or Consumption by Percentage | |
| Share: United States | |
| Lowest 10% | 1.8 |
| Lowest 20% | 5.2 |
| Second 20% | 10.5 |
| Third 20% | 15.6 |
| Fourth 20% | 22.4 |
| Highest 20% | 46.4 |
| Highest 10% | 30.5 |
| Survey year: 1997 | |
| Note: This information refers to income shares by percentiles of the population and is ranked by per capita income. | |
| SOURCE: 2000 World Development Indicators [CD-ROM]. | |
to the Human Development Report 2000 published by the United Nations (Canada ranks number 1, while Norway ranks 2). The average American workweek is 39.2 hours and the per capita income is $29,683. The average household in the United States had 2.6 people in it, but 25 percent of all homes had only 1 person. Only 10.4 percent of households had 5 or more people.
Almost 100 percent of households in the country have access to electricity and 99.4 percent have access to safe drinking water. In addition, 93.9 percent of homes had telephones while 98.3 percent had televisions and 99 percent had radios. The nation's sewage system is highly developed and 77 percent of dwellings are serviced by public sewage systems, and most of the remainder by septic tanks (22.8 percent). The mobility of the population is reflected in the high level of car ownership (84.9 percent of the people own an automobile). The average American spends 22.4 minutes commuting to and from work each day. Almost 80 percent of people who drive to work commute alone, while 14.7 percent car pool and 5.3 percent use public transportation.
In spite of the high overall standard of living, many groups in the United States are excluded from the prosperity of the mainstream. For instance, the unemployment rate for African Americans and Hispanics is almost twice as high as that of Asians and whites. Among workers, average wages for white males was $600 per week, $450 per week for African American males, and $390 per week for Hispanic males. Wages for women mirror the trends among male workers, with the major exception that females on average earn about 70 percent of what males earn.
In 1997, the poverty level in the United States was $16,036 for a family of 4. As with income differences, the poverty rate varies greatly among ethnic groups. In 1997, the poverty rate for whites was 11 percent. For Asians it was 15 percent, while for African Americans it was 28 percent, and 29 percent for Hispanics. Differences in poverty and income have a major impact on health. African Americans and Hispanics are twice as likely as whites not to have health insurance. One result of this disparity in health care is that whites have longer life expectancies. In 1997, the average life expectancy for white women was 80 years, but for African American women it was 74 years. Meanwhile the life expectancy for white males was 75 years, but for African American males it was 66 years.