Netherlands - Balance of payments
Dutch merchandise and services exports have grown to represent more than 50% of GDP, making the Dutch economy one of the most internationally oriented in the world. Economic expansion of the Netherlands in the period immediately after World War II paralleled a generally favorable balance of payments. After occasional and minor deficits on current accounts during the mid-1960s, a major deficit occurred in 1970. Since then, the current-accounts balance has generally registered a surplus, despite increased costs of oil imports during the 1970s. The Netherlands' reliance upon exports that are resistant to recessions (such as some food and agricultural products, and semifinished products such as chemicals) has protected the Dutch economy from weaker demand from Germany and other EU countries during recessions. Dutch exports are likely to be susceptible to an increase in the demand for capital goods spurred by a recovery in world trade, however.
The US Central Intelligence Agency (CIA) reports that in 2001 the purchasing power parity of the Netherlands's exports was $221.9 billion while imports totaled $201.1 billion resulting in a trade surplus of $20.8 billion.
The International Monetary Fund (IMF) reports that in 2001 the Netherlands had exports of goods totaling $202.9 billion and imports totaling $183.1 billion. The services credit totaled $52.9 billion and debit $54.9 billion. The following table summarizes the Netherlands's balance of payments as reported by the IMF for 2001 in millions of US dollars.
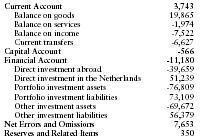
| Current Account | 3,743 |
| Balance on goods | 19,865 |
| Balance on services | -1,974 |
| Balance on income | -7,522 |
| Current transfers | -6,627 |
| Capital Account | -566 |
| Financial Account | -11,180 |
| Direct investment abroad | -39,659 |
| Direct investment in the Netherlands | 51,239 |
| Portfolio investment assets | -76,809 |
| Portfolio investment liabilities | 73,109 |
| Other investment assets | -69,672 |
| Other investment liabilities | 56,379 |
| Net Errors and Omissions | 7,653 |
| Reserves and Related Items | 350 |