Sri Lanka - Public finance
Fiscal targets are of particular concern because the government's chronic high fiscal deficits, which averaged a little over 9% of GDP 1997 to 2002, more than three times the ratio considered prudent, have led to problematic national debt. Total government debt as a percent of GDP rose from 85.8% in 1997 to 113.6% in 2002. The main causes of the persistent high budget overruns area an associated combination of welfare and pension expenditures, weak tax administration, and loses by the Ceylon Electricity Board (CEB). In September 2002, the government enacted a Welfare Benefit Law aimed at clarifying welfare eligibility and establishing penalties to reduce politicization and mistargeting. In January 2003, the government also passed the Fiscal Management Responsibility Act (FMRA) setting medium-term deficit targets and mandating "pre-election budget reports" to discourage pre-election handouts, as well as a new Board of Investment (BOI) Law eliminating the BOI's power to grant extra-legal incentives. These measures helped secure IMF approval on 8 April 2003 of a three-year program under the combined Poverty Reduction and Growth Facility and Extended Fund Facility (PRGF and EFF), with a total available credit line of SDR 413.4 ($567 million). The PRGF-EFF program is in direct support of the government's program for 2003–2006 aimed at poverty reduction through private sector growth. Historically, Sri Lanka, though low on per capita income, has been relatively high on other social welfare indicators such as adult literacy (90%), school enrollment, infant morality and life expectancy (72 years). The challenge will be to maintain welfare and educational standards while bringing the budget deficit under control.
The US Central Intelligence Agency (CIA) estimates that in 2001 Sri Lanka's central government took in revenues of approximately $2.8 billion and had expenditures of $4.1 billion. Overall, the government registered a deficit of approximately $1.3 billion. External debt totaled $9.9 billion.
The following table shows an itemized breakdown of government revenues and expenditures. The percentages were calculated from data reported by the International Monetary Fund. The dollar amounts (millions) are based on the CIA estimates provided above.
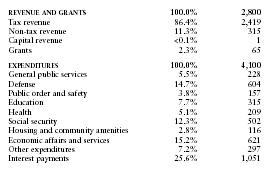
| REVENUE AND GRANTS | 100.0% | 2,800 |
| Tax revenue | 86.4% | 2,419 |
| Non-tax revenue | 11.3% | 315 |
| Capital revenue | <0.1% | 1 |
| Grants | 2.3% | 65 |
| EXPENDITURES | 100.0% | 4,100 |
| General public services | 5.5% | 228 |
| Defense | 14.7% | 604 |
| Public order and safety | 3.8% | 157 |
| Education | 7.7% | 315 |
| Health | 5.1% | 209 |
| Social security | 12.3% | 502 |
| Housing and community amenities | 2.8% | 116 |
| Economic affairs and services | 15.2% | 621 |
| Other expenditures | 7.2% | 297 |
| Interest payments | 25.6% | 1,051 |
Comment about this article, ask questions, or add new information about this topic: