Canada - Public finance
By far the largest item of expenditure of the federal government is for social services, including universal pension plans, old age security, veterans benefits, unemployment insurance, family and youth allowances, and assistance to disabled, handicapped, unemployed, and other needy persons.
Through the early 1970s, federal budgets remained relatively in balance, fluctuating between small surpluses and small deficits. Since then, however, the budget has been in continuous and growing deficit. The federal debt rose from 18% of GDP in 1974 to 70% of GDP in 1993, and about 65% in 1999. Government options to reduce the deficit are constrained by the high level of non-discretionary spending in the federal budget.
Sources of provincial revenue include various licenses, permits, fines, penalties, sales taxes, and royalties, augmented by federal subsidies, health grants, and other payments. Federal grants and surpluses and federal payments to the provinces under the federal-provincial tax-sharing arrangements constitute a major revenue source of the provinces. Corporation and personal income taxes provide a considerable portion of the revenue of Québec. The largest provincial expenditures are for highways, health and social welfare, education, natural resources, and primary industries. Real property taxes account for more than two-thirds of revenue for municipalities and other local authorities. Almost one-third of their expenditures go to supporting local schools.
The US Central Intelligence Agency (CIA) estimates that in 2000/2001 Canada's central government took in revenues of approximately US $178.6 billion and had expenditures of US $161.4 billion. Overall, the government registered a surplus of approximately US $17.2 billion. External debt totaled US $1.9 billion.
The following table shows an itemized breakdown of government revenues and expenditures. The percentages were calculated from data reported by the International Monetary Fund. The dollar amounts (millions) are based on the CIA estimates provided above.
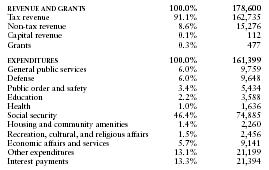
| REVENUE AND GRANTS | 100.0% | 178,600 |
| Tax revenue | 91.1% | 162,735 |
| Non-tax revenue | 8.6% | 15,276 |
| Capital revenue | 0.1% | 112 |
| Grants | 0.3% | 477 |
| EXPENDITURES | 100.0% | 161,399 |
| General public services | 6.0% | 9,759 |
| Defense | 6.0% | 9,648 |
| Public order and safety | 3.4% | 5,434 |
| Education | 2.2% | 3,588 |
| Health | 1.0% | 1,636 |
| Social security | 46.4% | 74,885 |
| Housing and community amenities | 1.4% | 2,260 |
| Recreation, cultural, and religious affairs | 1.5% | 2,456 |
| Economic affairs and services | 5.7% | 9,141 |
| Other expenditures | 13.1% | 21,199 |
| Interest payments | 13.3% | 21,394 |
Comment about this article, ask questions, or add new information about this topic: