United Kingdom - Public finance
National budget deficits recurred throughout the 1970s and early and mid-1980s. Between 1987–88 and 1990–91, the public sector was in surplus, so the government repaid debt. The onset of recession in 1990 led to an increased level of public borrowing—about £14 billion in 1991–92, or 2.25% of GDP. By 1993–94, the public sector borrowing requirement had risen to £50 billion, or 8.1% of GDP. In 1994 the government initiated a series of stringent fiscal measures designed to curb the spiraling public sector borrowing requirement (PSBR).
Since 1998, the United Kingdom has taken agressive steps to reform its public spending activities. Reforms included limits on expenditures, higher governmental accountability regarding spending, better resource budgeting, and improved spending flexibility.
The US Central Intelligence Agency (CIA) estimates that in 2001 the United Kingdom's central government took in revenues of approximately $565 billion and had expenditures of $540 billion. Overall, the government registered a surplus of approximately $25 billion.
The following table shows an itemized breakdown of government revenues and expenditures. The percentages were calculated from data reported by the International Monetary Fund. The dollar amounts (millions) are based on the CIA estimates provided above.
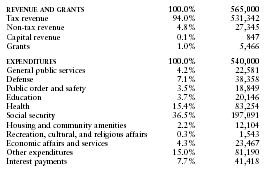
| REVENUE AND GRANTS | 100.0% | 565,000 |
| Tax revenue | 94.0% | 531,342 |
| Non-tax revenue | 4.8% | 27,345 |
| Capital revenue | 0.1% | 847 |
| Grants | 1.0% | 5,466 |
| EXPENDITURES | 100.0% | 540,000 |
| General public services | 4.2% | 22,581 |
| Defense | 7.1% | 38,358 |
| Public order and safety | 3.5% | 18,849 |
| Education | 3.7% | 20,146 |
| Health | 15.4% | 83,254 |
| Social security | 36.5% | 197,091 |
| Housing and community amenities | 2.2% | 12,104 |
| Recreation, cultural, and religious affairs | 0.3% | 1,543 |
| Economic affairs and services | 4.3% | 23,467 |
| Other expenditures | 15.0% | 81,190 |
| Interest payments | 7.7% | 41,418 |
Comment about this article, ask questions, or add new information about this topic: