United Kingdom - Balance of payments
Throughout the 1960s, revaluations of other currencies adversely affected the pound sterling. Large deficits in the balance of payments appeared in 1964 and 1967, leading to a devaluation in November 1967. Another run on sterling prompted a decision to let the pound float on 23 June 1972. The pound then declined steadily, dropping below a value of $2.00 for the first time on 9 March 1976. The oil crisis and the rise in commodity prices in 1974 were even harsher blows to the UK economy. Increasing unemployment, the worldwide recession, and a large budgetary deficit placed the government in an extremely difficult position, since replenishment of currency reserves cost more in terms of sterling, and the need to curb inflation prevented expansion in the economy. Borrowing from the oil-producing states and the EU helped finance the deficits, but a further approach to the IMF became necessary. During the late 1970s, the UK's visible trade balance was generally negative, although surpluses on invisibles sometimes were sufficient to produce a surplus in current account. Increased North Sea oil exports helped produce substantial trade surpluses in 1980–82. The United Kingdom has run a deficit in visible trade since 1983, reaching a peak of $47 billion in 1989, as consumer demand for imported goods ballooned. As recession took hold, imports fell, reducing the visible trade deficit dramatically in 1991. The devaluation of the pound, following the UK's late 1992 withdrawal from the EU's Exchange Rate Mechanism, increased the cost of imports at the end of 1992. However, the sterling's trade-weighted exchange rate index stabilized by 1995. In recent years, the export-oriented manufacturing sector has been challenged by an overvalued exchange rate. The United Kingdom is a major overseas investor (especially in the US) and has an extremely important service sector, dominated by banking and insurance, which consistently generates invisible trade credits.
The US Central Intelligence Agency (CIA) reports that in 2002 the purchasing power parity of the United Kingdom's exports was $286.3 billion while imports totaled $330.1 billion resulting in a trade deficit of $43.8 billion.
The International Monetary Fund (IMF) reports that in 2001 the United Kingdom had exports of goods totaling $276 billion and imports totaling $324 billion. The services credit totaled $111 billion and debit $95 billion. The following table summarizes the United Kingdom's balance of payments as reported by the IMF for 2001 in billions of US dollars.
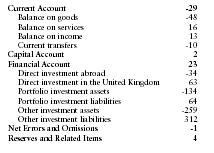
| Current Account | -29 |
| Balance on goods | -48 |
| Balance on services | 16 |
| Balance on income | 13 |
| Current transfers | -10 |
| Capital Account | 2 |
| Financial Account | 23 |
| Direct investment abroad | -34 |
| Direct investment in the United Kingdom | 63 |
| Portfolio investment assets | -134 |
| Portfolio investment liabilities | 64 |
| Other investment assets | -259 |
| Other investment liabilities | 312 |
| Net Errors and Omissions | -1 |
| Reserves and Related Items | 4 |
Comment about this article, ask questions, or add new information about this topic: