Sweden - Foreign trade
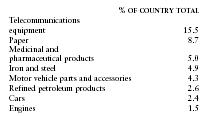
The volume of Sweden's foreign trade has increased very rapidly since World War II, mainly as a result of the gradual liberalization of trade restrictions within the framework of OECD, EFTA, and the EU. Telecommunications equipment, automobile manufacturing, and logging, dominate export commodities from Sweden. The top eight exports are as follows:
| % OF COUNTRY TOTAL | ||
| Telecommunications | ||
| equipment | 15.5 | |
| Paper | 8.7 | |
|
Medicinal and
pharmaceutical products |
5.0 | |
| Iron and steel | 4.9 | |
| Motor vehicle parts and accessories | 4.3 | |
| Refined petroleum products | 2.6 | |
| Cars | 2.4 | |
| Engines 1.5 |
In 2000 Sweden's imports were distributed among the following categories:
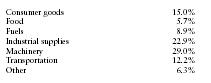
| Consumer goods | 15.0% |
| Food | 5.7% |
| Fuels | 8.9% |
| Industrial supplies | 22.9% |
| Machinery | 29.0% |
| Transportation | 12.2% |
| Other | 6.3% |
Principal trading partners in 2000 (in millions of US dollars) were as follows:
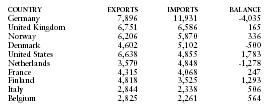
| COUNTRY | EXPORTS | IMPORTS | BALANCE |
| Germany | 7,896 | 11,931 | -4,035 |
| United Kingdom | 6,751 | 6,586 | 165 |
| Norway | 6,206 | 5,870 | 336 |
| Denmark | 4,602 | 5,102 | -500 |
| United States | 6,638 | 4,855 | 1,783 |
| Netherlands | 3,570 | 4,848 | -1,278 |
| France | 4,315 | 4,068 | 247 |
| Finland | 4,818 | 3,525 | 1,293 |
| Italy | 2,844 | 2,338 | 506 |
| Belgium | 2,825 | 2,261 | 564 |
Also read article about Sweden from Wikipedia
Comment about this article, ask questions, or add new information about this topic: