Spain - Foreign trade
Traditionally, exports consisted mainly of agricultural products (chiefly wine, citrus fruits, olives and olive oil, and cork) and minerals. While agricultural products and minerals remain important, they have, since the 1960s, been overtaken by industrial exports. Imports habitually exceed exports by a large margin.
Of Spain's export commodities, transport-related items make up at least 23% of the total. Fruits, nuts, and vegetables are also exported in sizable amounts. The following shows the top ten exports:
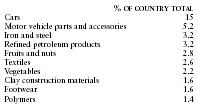
| % OF COUNTRY TOTAL | ||
| Cars | 15 | |
| Motor vehicle parts and accessories | 5.2 | |
| Iron and steel | 3.2 | |
| Refined petroleum products | 3.2 | |
| Fruits and nuts | 2.8 | |
| Textiles | 2.6 | |
| Vegetables | 2.2 | |
| Clay construction materials | 1.6 | |
| Footwear | 1.6 | |
| Polymers | 1.4 |
In 2000 Spain's imports were distributed among the following categories:
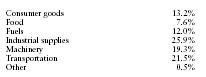
| Consumer goods | 13.2% |
| Food | 7.6% |
| Fuels | 12.0% |
| Industrial supplies | 25.9% |
| Machinery | 19.3% |
| Transportation | 21.5% |
| Other | 0.5% |
Principal trading partners in 2000 (in millions of US dollars) were as follows:
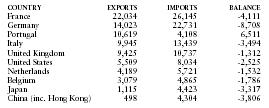
| COUNTRY | EXPORTS | IMPORTS | BALANCE |
| France | 22,034 | 26,145 | -4,111 |
| Germany | 14,023 | 22,731 | -8,708 |
| Portugal | 10,619 | 4,108 | 6,511 |
| Italy | 9,945 | 13,439 | -3,494 |
| United Kingdom | 9,425 | 10,737 | -1,312 |
| United States | 5,509 | 8,034 | -2,525 |
| Netherlands | 4,189 | 5,721 | -1,532 |
| Belgium | 3,079 | 4,865 | -1,786 |
| Japan | 1,115 | 4,423 | -3,317 |
| China (inc. Hong Kong) | 498 | 4,304 | -3,806 |
WITH BEST REGARDS.