France - Foreign trade

Leading French exports, by major categories, are capital goods (machinery, heavy electrical equipment, transport equipment, and aircraft), consumer goods (automobiles, textiles, and leather), and semi-finished products (mainly chemicals, iron, and steel). Major imports are fuels, machinery and equipment, chemicals and paper goods, and consumer goods.
The French trade balance was favorable in 1961 for the first time since 1927, but after 1961 imports rose at a higher rate than exports. Trade deficits generally increased until the 1990s. From 1977 to 1985, the trade deficit nearly tripled. Among factors held responsible were heavy domestic demand for consumer products not widely produced in France, narrowness of the range of major exports, and a concentration on markets not ripe for expansion of exports from France, notably the EU and OPEC countries. In the following years a growing change in the trade balance developed, and the deficit narrowed appreciably in 1992. By 1995, France had a trade surplus of $34 billion. In all, France is the world's fourth largest exporter of goods and the second largest provider of services and agriculture. France is the largest producer and exporter of farm products in Europe.
Garnering the highest revenues of export commodities from France are transport machinery, including automobiles, vehicle parts, and aircraft (12.5%). French wine, perfumes, and cosmetics represent about a quarter each of the world market in their respective categories. The top ten exports in 2000 were as follows:
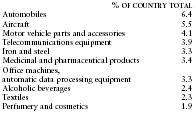
| % OF COUNTRY TOTAL | |
| Automobiles | 6.4 |
| Aircraft | 5.5 |
| Motor vehicle parts and accessories | 4.1 |
| Telecommunications equipment | 3.9 |
| Iron and steel | 3.3 |
| Medicinal and pharmaceutical products | 3.4 |
| Office machines, automatic data processing equipment | 3.3 |
| Alcoholic beverages | 2.4 |
| Textiles | 2.3 |
| Perfumery and cosmetics | 1.9 |
In 2000 France's imports were distributed among the following categories:
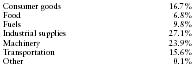
| Consumer goods | 16.7% |
| Food | 6.8% |
| Fuels | 9.8% |
| Industrial supplies | 27.1% |
| Machinery | 23.9% |
| Transportation | 15.6% |
| Other | 0.1% |
Principal trading partners in 2000 (in millions of US dollars) were as follows:
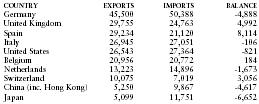
| COUNTRY | EXPORTS | IMPORTS | BALANCE |
| Germany | 45,500 | 50,388 | -4,888 |
| United Kingdom | 29,755 | 24,763 | 4,992 |
| Spain | 29,234 | 21,120 | 8,114 |
| Italy | 26,945 | 27,051 | -106 |
| United States | 26,543 | 27,364 | -821 |
| Belgium | 20,956 | 20,772 | 184 |
| Netherlands | 13,223 | 14,896 | -1,673 |
| Switzerland | 10,075 | 7,019 | 3,056 |
| China (inc. Hong Kong) | 5,250 | 9,867 | -4,617 |
| Japan | 5,099 | 11,751 | -6,652 |
Thanks
thank you
great!