Japan - Public finance
Plans for the national budget usually begin in August, when various agencies submit their budget requests to the Ministry of Finance. On the basis of such requests, the ministry, other government agencies, and the ruling party start negotiations. The government budget plan usually is approved by the Diet without difficulty, and the budget goes into effect in April. Deficits, financed by public bond sales, have steadily increased in size since the 1973 oil crisis. As a result, the ratio of gross debt to GNP has risen from 8% in 1970 to 60% by 1987. By 1990, debt servicing was absorbing over 20% of budgeted expenditures.
Since 1982, Japan has pursued tight fiscal policies and has attempted to constrain government debt. In June 1987, however, as a response to appeals from other nations to reduce international imbalances, Japan initiated a $35 billion public works spending package, followed up by $10 billion in tax cuts. In recent years, however, fiscal stimulus policies have contributed to an increasing budget deficit. Japan's government deficit was 3% of GDP in 1994 and reached 4.3% of GDP in 1995, due to ongoing high levels of public sector borrowing. The government's focus on fiscal policy to compensate for a tight monetary policy has restricted spending on infrastructure, yet by 2002, the deficit had reached 7.8% of GDP.
The US Central Intelligence Agency (CIA) estimates that in 2002 Japan's central government took in revenues of approximately $441 billion and had expenditures of $718 billion including capital expenditures of $84 billion. Overall, the government registered a deficit of approximately $277 billion.
The following table shows an itemized breakdown of government revenues and expenditures. The percentages were calculated from data reported by the International Monetary Fund. The dollar amounts (millions) are based on the CIA estimates provided above.
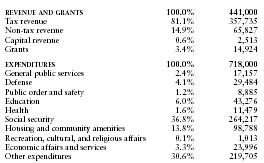
| REVENUE AND GRANTS | 100.0% | 441,000 |
| Tax revenue | 81.1% | 357,735 |
| Non-tax revenue | 14.9% | 65,827 |
| Capital revenue | 0.6% | 2,513 |
| Grants | 3.4% | 14,924 |
| EXPENDITURES | 100.0% | 718,000 |
| General public services | 2.4% | 17,157 |
| Defense | 4.1% | 29,484 |
| Public order and safety | 1.2% | 8,885 |
| Education | 6.0% | 43,276 |
| Health | 1.6% | 11,479 |
| Social security | 36.8% | 264,217 |
| Housing and community amenities | 13.8% | 98,788 |
| Recreation, cultural, and religious affairs | 0.1% | 1,013 |
| Economic affairs and services | 3.3% | 23,996 |
| Other expenditures | 30.6% | 219,705 |
Comment about this article, ask questions, or add new information about this topic: