United States - Balance of payments
Since 1950, the United States has generally recorded deficits in its overall payments with the rest of the world, despite the fact that it had an unbroken record of annual surpluses up to 1970 on current-account goods, services, and remittances transactions. The balance of trade, in the red since 1975, reached a record deficit of $249 billion in 1998. The nation's stock of gold declined from a value of $22.9 billion at the start of 1958 to $10.5 billion as of 31 July 1971, only two weeks before President Nixon announced that the United States would no longer exchange dollars for gold. From 1990–98, the value of the gold stock was stable at $11 billion. On 12 February 1973,
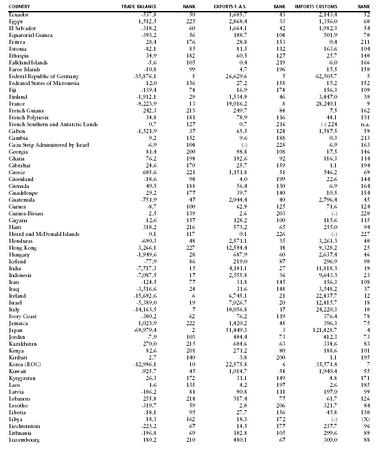
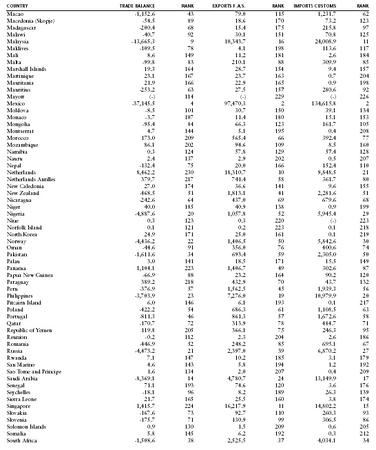
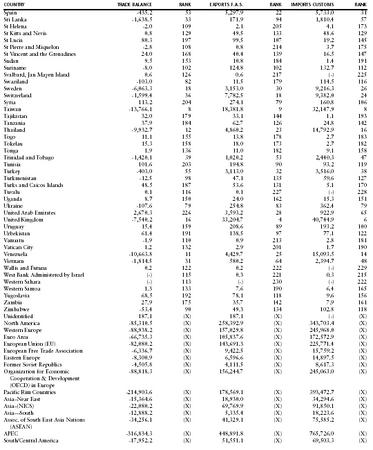
Exports, Imports and Trade Balance by Country and Area: 2002 Annual Totals
In millions of dollars. Details may not equal totals due to rounding. (X) Not applicable. (-) Represents zero or less than one-half of value shown. January–December, Cumulative
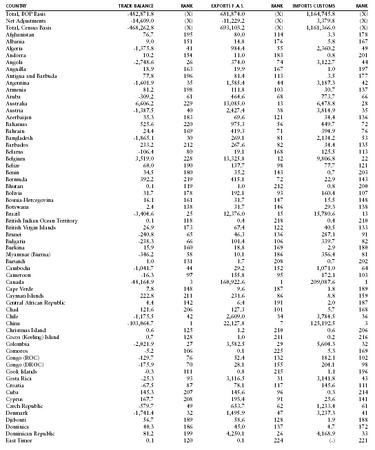
| COUNTRY | TRADE BALANCE | RANK | EXPORTS F . A . S . | RANK | IMPORTS CUSTOMS | RANK |
| Total, BOP Basis | -482,871.8 | (X) | 681,874.0 | (X) | 1,164,745.8 | (X) |
| Net Adjustments | -14,609.0 | (X) | -11,229.2 | (X) | 3,379.8 | (X) |
| Total, Census Basis | -468,262.8 | (X) | 693,103.2 | (X) | 1,161,366.0 | (X) |
| Afghanistan | 76.7 | 195 | 80.0 | 114 | 3.3 | 178 |
| Albania | 9.0 | 151 | 14.8 | 176 | 5.8 | 167 |
| Algeria | -1,375.8 | 41 | 984.4 | 55 | 2,360.2 | 49 |
| Andorra | 10.2 | 154 | 11.0 | 183 | 0.8 | 201 |
| Angola | -2,748.6 | 26 | 374.0 | 74 | 3,122.7 | 44 |
| Anguilla | 18.9 | 163 | 19.9 | 167 | 1.0 | 197 |
| Antigua and Barbuda | 77.8 | 196 | 81.4 | 113 | 3.5 | 177 |
| Argentina | -1,601.9 | 35 | 1,585.4 | 44 | 3,187.3 | 42 |
| Armenia | 81.2 | 198 | 111.8 | 103 | 30.7 | 137 |
| Aruba | -309.2 | 61 | 464.6 | 68 | 773.7 | 66 |
| Australia | 6,606.2 | 229 | 13,085.0 | 13 | 6,478.8 | 28 |
| Austria | -1,387.5 | 40 | 2,427.4 | 38 | 3,814.9 | 35 |
| Azerbaijan | 35.3 | 183 | 69.6 | 121 | 34.4 | 136 |
| Bahamas | 525.6 | 220 | 975.3 | 56 | 449.7 | 72 |
| Bahrain | 24.4 | 169 | 419.3 | 71 | 394.9 | 76 |
| Bangladesh | -1,865.1 | 30 | 269.1 | 81 | 2,134.2 | 53 |
| Barbados | 233.2 | 212 | 267.6 | 82 | 34.4 | 135 |
| Belarus | -106.4 | 80 | 19.1 | 168 | 125.5 | 113 |
| Belgium | 3,519.0 | 228 | 13,325.8 | 12 | 9,806.8 | 22 |
| Belize | 60.0 | 190 | 137.7 | 98 | 77.7 | 121 |
| Benin | 34.5 | 180 | 35.2 | 143 | 0.7 | 203 |
| Bermuda | 392.2 | 219 | 415.1 | 72 | 22.9 | 143 |
| Bhutan | 0.1 | 119 | 1.0 | 212 | 0.8 | 200 |
| Bolivia | 31.7 | 178 | 192.1 | 93 | 160.4 | 107 |
| Bosnia-Hercegovina | 16.1 | 161 | 31.7 | 147 | 15.5 | 148 |
| Botswana | 2.4 | 138 | 31.7 | 146 | 29.3 | 138 |
| Brazil | -3,404.6 | 25 | 12,376.0 | 15 | 15,780.6 | 13 |
| British Indian Ocean Territory | 0.1 | 118 | 0.4 | 218 | 0.4 | 210 |
| British Virgin Islands | 26.9 | 173 | 67.4 | 122 | 40.5 | 133 |
| Brunei | -240.8 | 65 | 46.3 | 136 | 287.1 | 91 |
| Bulgaria | -238.3 | 66 | 101.4 | 106 | 339.7 | 82 |
| Burkina | 15.9 | 160 | 18.8 | 169 | 2.9 | 180 |
| Myanmar (Burma) | -346.2 | 58 | 10.1 | 186 | 356.4 | 81 |
| Burundi | 1.0 | 131 | 1.7 | 208 | 0.7 | 202 |
| Cambodia | -1,041.7 | 44 | 29.2 | 152 | 1,071.0 | 64 |
| Cameroon | -16.3 | 97 | 155.8 | 95 | 172.1 | 103 |
| Canada | -48,164.9 | 3 | 160,922.6 | 1 | 209,087.6 | 1 |
| Cape Verde | 7.8 | 148 | 9.6 | 187 | 1.8 | 189 |
| Cayman Islands | 222.8 | 211 | 231.6 | 86 | 8.8 | 159 |
| Central African Republic | 4.4 | 142 | 6.4 | 191 | 2.0 | 187 |
| Chad | 121.6 | 206 | 127.3 | 101 | 5.7 | 168 |
| Chile | -1,175.5 | 42 | 2,609.0 | 34 | 3,784.5 | 36 |
| China | -103,064.7 | 1 | 22,127.8 | 7 | 125,192.5 | 3 |
| Christmas Island | 0.6 | 125 | 1.2 | 210 | 0.6 | 206 |
| Cocos (Keeling) Island | 0.7 | 128 | 1.0 | 211 | 0.2 | 216 |
| Colombia | -2,021.9 | 27 | 3,582.5 | 29 | 5,604.3 | 32 |
| Comoros | -5.2 | 106 | 0.1 | 225 | 5.3 | 169 |
| Congo (ROC) | -129.7 | 76 | 52.4 | 132 | 182.1 | 102 |
| Congo (DROC) | -175.9 | 70 | 28.1 | 155 | 204.1 | 98 |
| Cook Islands | -0.3 | 111 | 0.8 | 215 | 1.1 | 196 |
| Costa Rica | -25.3 | 93 | 3,116.5 | 31 | 3,141.8 | 43 |
| Croatia | -67.5 | 87 | 78.1 | 117 | 145.6 | 111 |
| Cuba | 145.3 | 207 | 145.6 | 96 | 0.3 | 214 |
| Cyprus | 167.7 | 208 | 193.4 | 91 | 25.6 | 141 |
| Czech Republic | -579.7 | 49 | 653.7 | 62 | 1,233.4 | 61 |
| Denmark | -1,741.4 | 32 | 1,495.9 | 47 | 3,237.3 | 41 |
| Djibouti | 56.7 | 189 | 58.6 | 128 | 1.9 | 188 |
| Dominica | 40.3 | 186 | 45.0 | 137 | 4.7 | 172 |
| Dominican Republic | 81.2 | 199 | 4,250.1 | 26 | 4,168.9 | 33 |
| East Timor | 0.1 | 120 | 0.1 | 224 | (-) | 221 |
| COUNTRY | TRADE BALANCE | RANK | EXPORTS F . A . S . | RANK | IMPORTS CUSTOMS | RANK |
| Ecuador | -537.8 | 50 | 1,605.7 | 43 | 2,143.4 | 52 |
| Egypt | 1,512.5 | 225 | 2,868.4 | 33 | 1,356.0 | 60 |
| El Salvador | -318.2 | 60 | 1,664.1 | 42 | 1,982.3 | 54 |
| Equatorial Guinea | -393.2 | 56 | 108.7 | 104 | 501.9 | 70 |
| Eritrea | 28.4 | 176 | 28.8 | 153 | 0.4 | 211 |
| Estonia | -82.1 | 85 | 81.5 | 112 | 163.6 | 104 |
| Ethiopia | 34.9 | 182 | 60.5 | 127 | 25.7 | 140 |
| Falkland Islands | -5.6 | 105 | 0.4 | 219 | 6.0 | 166 |
| Faroe Islands | -10.8 | 99 | 4.7 | 196 | 15.5 | 150 |
| Federal Republic of Germany | -35,876.1 | 5 | 26,629.6 | 5 | 62,505.7 | 5 |
| Fedrated States of Micronesia | 12.0 | 156 | 27.2 | 158 | 15.2 | 152 |
| Fiji | -139.4 | 74 | 16.9 | 174 | 156.3 | 109 |
| Finland | -1,912.1 | 29 | 1,534.9 | 46 | 3,447.0 | 39 |
| France | -9,223.9 | 13 | 19,016.2 | 8 | 28,240.1 | 9 |
| French Guiana | 242.3 | 213 | 249.7 | 84 | 7.5 | 162 |
| French Polynesia | 34.8 | 181 | 78.9 | 116 | 44.1 | 131 |
| French Southern and Antarctic Lands | 0.7 | 127 | 0.7 | 216 | (-) 224 | n.a. |
| Gabon | -1,521.9 | 37 | 65.5 | 124 | 1,587.5 | 59 |
| Gambia | 9.2 | 152 | 9.6 | 188 | 0.3 | 213 |
| Gaza Strip Administered by Israel | -6.9 | 104 | (-) | 228 | 6.9 | 163 |
| Georgia | 81.4 | 200 | 98.8 | 108 | 17.5 | 146 |
| Ghana | 76.2 | 194 | 192.6 | 92 | 116.3 | 114 |
| Gibraltar | 24.6 | 170 | 25.7 | 159 | 1.1 | 194 |
| Greece | 605.6 | 221 | 1,151.8 | 51 | 546.2 | 69 |
| Greenland | -18.6 | 94 | 4.0 | 199 | 22.6 | 144 |
| Grenada | 49.5 | 188 | 56.4 | 130 | 6.9 | 164 |
| Guadeloupe | 29.2 | 177 | 39.7 | 140 | 10.5 | 154 |
| Guatemala | -751.9 | 47 | 2,044.4 | 40 | 2,796.4 | 45 |
| Guinea | -8.7 | 100 | 62.9 | 125 | 71.6 | 124 |
| Guinea-Bissau | 2.5 | 139 | 2.6 | 203 | (-) | 220 |
| Guyana | 12.6 | 157 | 128.2 | 100 | 115.6 | 115 |
| Haiti | 318.2 | 216 | 573.2 | 65 | 255.0 | 94 |
| Heard and McDonald Islands | 0.1 | 117 | 0.1 | 226 | (-) | 227 |
| Honduras | -690.3 | 48 | 2,571.1 | 35 | 3,261.3 | 40 |
| Hong Kong | 3,266.1 | 227 | 12,594.4 | 14 | 9,328.2 | 25 |
| Hungary | -1,949.6 | 28 | 687.9 | 60 | 2,637.4 | 46 |
| Iceland | -77.9 | 86 | 219.0 | 87 | 296.9 | 90 |
| India | -7,717.3 | 15 | 4,101.1 | 27 | 11,818.3 | 19 |
| Indonesia | -7,087.5 | 17 | 2,555.8 | 36 | 9,643.3 | 23 |
| Iran | -124.5 | 77 | 31.8 | 145 | 156.3 | 108 |
| Iraq | -3,516.6 | 24 | 31.6 | 148 | 3,548.2 | 37 |
| Ireland | -15,692.6 | 6 | 6,745.1 | 21 | 22,437.7 | 12 |
| Israel | -5,389.0 | 19 | 7,026.7 | 20 | 12,415.7 | 18 |
| Italy | -14,163.5 | 7 | 10,056.8 | 17 | 24,220.3 | 10 |
| Ivory Coast | -300.2 | 62 | 76.2 | 119 | 376.4 | 78 |
| Jamaica | 1,023.9 | 222 | 1,420.2 | 48 | 396.3 | 75 |
| Japan | -69,979.4 | 2 | 51,449.3 | 3 | 121,428.7 | 4 |
| Jordan | -7.9 | 103 | 404.4 | 73 | 412.3 | 73 |
| Kazakhstan | 270.0 | 215 | 604.6 | 63 | 334.6 | 83 |
| Kenya | 82.6 | 201 | 271.2 | 80 | 188.6 | 101 |
| Kiribati | 2.7 | 140 | 3.8 | 200 | 1.1 | 195 |
| Korea (ROC) | -12,996.1 | 10 | 22,575.8 | 6 | 35,571.8 | 7 |
| Kuwait | -925.7 | 45 | 1,014.7 | 54 | 1,940.4 | 55 |
| Kyrgyzstan | 26.3 | 172 | 31.1 | 149 | 4.8 | 171 |
| Laos | 1.6 | 135 | 4.2 | 197 | 2.6 | 185 |
| Latvia | -106.2 | 81 | 90.8 | 111 | 197.0 | 99 |
| Lebanon | 255.8 | 214 | 317.4 | 77 | 61.7 | 126 |
| Lesotho | -319.7 | 59 | 2.0 | 206 | 321.7 | 84 |
| Liberia | -18.1 | 95 | 27.7 | 156 | 45.8 | 130 |
| Libya | 18.3 | 162 | 18.3 | 172 | (-) | (X) |
| Liechtenstein | -223.2 | 67 | 14.5 | 177 | 237.7 | 96 |
| Lithuania | -196.8 | 69 | 102.8 | 105 | 299.6 | 89 |
| Luxembourg | 180.2 | 210 | 480.1 | 67 | 300.0 | 88 |
| COUNTRY | TRADE BALANCE | RANK | EXPORTS F . A . S . | RANK | IMPORTS CUSTOMS | RANK |
| Macao | -1,152.6 | 43 | 79.0 | 115 | 1,231.7 | 62 |
| Macedonia (Skopje) | -54.5 | 89 | 18.6 | 170 | 73.2 | 123 |
| Madagascar | -200.4 | 68 | 15.4 | 175 | 215.8 | 97 |
| Malawi | -40.7 | 92 | 30.1 | 151 | 70.8 | 125 |
| Malaysia | -13,665.3 | 9 | 10,343.7 | 16 | 24,008.9 | 11 |
| Maldives | -109.5 | 78 | 4.1 | 198 | 113.6 | 117 |
| Mali | 8.6 | 149 | 11.2 | 181 | 2.6 | 184 |
| Malta | -99.8 | 83 | 210.1 | 88 | 309.9 | 85 |
| Marshall Islands | 19.3 | 164 | 28.7 | 154 | 9.4 | 157 |
| Martinique | 23.1 | 167 | 23.7 | 163 | 0.7 | 204 |
| Mauritania | 21.9 | 166 | 22.9 | 165 | 0.9 | 198 |
| Mauritius | -253.2 | 63 | 27.5 | 157 | 280.6 | 92 |
| Mayott | (-) | 114 | (-) | 229 | (-) | 226 |
| Mexico | -37,145.5 | 4 | 97,470.3 | 2 | 134,615.8 | 2 |
| Moldova | -8.5 | 101 | 30.7 | 150 | 39.1 | 134 |
| Monaco | -3.7 | 107 | 11.4 | 180 | 15.1 | 153 |
| Mongolia | -95.4 | 84 | 66.3 | 123 | 161.7 | 105 |
| Montserrat | 4.7 | 144 | 5.1 | 195 | 0.4 | 208 |
| Morocco | 173.0 | 209 | 565.4 | 66 | 392.4 | 77 |
| Mozambique | 86.1 | 202 | 94.6 | 109 | 8.5 | 160 |
| Namibia | 0.3 | 124 | 57.8 | 129 | 57.4 | 128 |
| Nauru | 2.4 | 137 | 2.9 | 202 | 0.5 | 207 |
| Nepal | -132.4 | 75 | 20.0 | 166 | 152.4 | 110 |
| Netherlands | 8,462.2 | 230 | 18,310.7 | 10 | 9,848.5 | 21 |
| Netherlands Antilles | 379.7 | 217 | 741.4 | 58 | 361.7 | 80 |
| New Caledonia | 27.0 | 174 | 36.6 | 141 | 9.6 | 155 |
| New Zealand | -468.5 | 51 | 1,813.1 | 41 | 2,281.6 | 51 |
| Nicaragua | -242.6 | 64 | 437.0 | 69 | 679.6 | 68 |
| Niger | 40.0 | 185 | 40.9 | 138 | 0.9 | 199 |
| Nigeria | -4,887.6 | 20 | 1,057.8 | 52 | 5,945.4 | 29 |
| Niue | 0.3 | 123 | 0.3 | 220 | (-) | 223 |
| Norfolk Island | 0.1 | 121 | 0.2 | 223 | 0.1 | 218 |
| North Korea | 24.9 | 171 | 25.0 | 161 | 0.1 | 219 |
| Norway | -4,436.2 | 22 | 1,406.5 | 50 | 5,842.6 | 30 |
| Oman | -44.6 | 91 | 356.0 | 76 | 400.6 | 74 |
| Pakistan | -1,611.6 | 34 | 693.4 | 59 | 2,305.0 | 50 |
| Palau | 3.0 | 141 | 18.5 | 171 | 15.5 | 149 |
| Panama | 1,104.1 | 223 | 1,406.7 | 49 | 302.6 | 87 |
| Papua New Guinea | -66.9 | 88 | 23.2 | 164 | 90.2 | 120 |
| Paraguay | 389.2 | 218 | 432.9 | 70 | 43.7 | 132 |
| Peru | -376.9 | 57 | 1,562.5 | 45 | 1,939.3 | 56 |
| Philippines | -3,703.9 | 23 | 7,276.0 | 19 | 10,979.9 | 20 |
| Pitcairn Island | 6.0 | 146 | 6.1 | 193 | 0.1 | 217 |
| Poland | -422.2 | 54 | 686.3 | 61 | 1,108.5 | 63 |
| Portugal | -811.3 | 46 | 861.3 | 57 | 1,672.6 | 58 |
| Qatar | -170.7 | 72 | 313.9 | 78 | 484.7 | 71 |
| Republic of Yemen | 119.8 | 205 | 366.1 | 75 | 246.3 | 95 |
| Reunion | -0.2 | 112 | 2.3 | 204 | 2.6 | 186 |
| Romania | -446.9 | 52 | 248.2 | 85 | 695.1 | 67 |
| Russia | -4,473.2 | 21 | 2,397.0 | 39 | 6,870.2 | 27 |
| Rwanda | 7.1 | 147 | 10.2 | 185 | 3.1 | 179 |
| San Marino | 4.6 | 143 | 5.8 | 194 | 1.2 | 192 |
| Sao Tome and Principe | 1.6 | 134 | 2.0 | 207 | 0.4 | 209 |
| Saudi Arabia | -8,369.1 | 14 | 4,780.7 | 24 | 13,149.9 | 17 |
| Senegal | 71.1 | 193 | 74.6 | 120 | 3.6 | 176 |
| Seychelles | -18.1 | 96 | 8.2 | 189 | 26.3 | 139 |
| Sierra Leone | 21.7 | 165 | 25.5 | 160 | 3.8 | 174 |
| Singapore | 1,415.7 | 224 | 16,217.9 | 11 | 14,802.2 | 15 |
| Slovakia | -167.6 | 73 | 92.7 | 110 | 260.3 | 93 |
| Slovenia | -175.7 | 71 | 130.9 | 99 | 306.5 | 86 |
| Solomon Islands | 0.9 | 130 | 1.5 | 209 | 0.6 | 205 |
| Somalia | 5.8 | 145 | 6.2 | 192 | 0.3 | 212 |
| South Africa | -1,508.6 | 38 | 2,525.5 | 37 | 4,034.1 | 34 |
| COUNTRY | TRADE BALANCE | RANK | EXPORTS F . A . S . | RANK | IMPORTS CUSTOMS | RANK |
| Spain | -435.2 | 53 | 5,297.9 | 22 | 5,733.0 | 31 |
| Sri Lanka | -1,638.5 | 33 | 171.9 | 94 | 1,810.4 | 57 |
| St Helena | -2.0 | 109 | 2.1 | 205 | 4.1 | 173 |
| St Kitts and Nevis | 0.8 | 129 | 49.5 | 133 | 48.6 | 129 |
| St Lucia | 80.3 | 197 | 99.5 | 107 | 19.2 | 145 |
| St Pierre and Miquelon | -2.8 | 108 | 0.8 | 214 | 3.7 | 175 |
| St Vincent and the Grenadines | 24.0 | 168 | 40.4 | 139 | 16.5 | 147 |
| Sudan | 9.5 | 153 | 10.8 | 184 | 1.4 | 191 |
| Suriname | -8.0 | 102 | 124.8 | 102 | 132.7 | 112 |
| Svalbard, Jan Mayen Island | 0.6 | 126 | 0.6 | 217 | (-) | 225 |
| Swaziland | -103.0 | 82 | 11.5 | 179 | 114.5 | 116 |
| Sweden | -6,063.3 | 18 | 3,153.0 | 30 | 9,216.3 | 26 |
| Switzerland | -1,599.4 | 36 | 7,782.5 | 18 | 9,382.0 | 24 |
| Syria | 113.2 | 204 | 274.1 | 79 | 160.8 | 106 |
| Taiwan | -13,766.1 | 8 | 18,381.8 | 9 | 32,147.9 | 8 |
| Tajikistan | 32.0 | 179 | 33.1 | 144 | 1.1 | 193 |
| Tanzania | 37.9 | 184 | 62.7 | 126 | 24.8 | 142 |
| Thailand | -9,932.7 | 12 | 4,860.2 | 23 | 14,792.9 | 16 |
| Togo | 11.1 | 155 | 13.8 | 178 | 2.7 | 183 |
| Tokelau | 15.3 | 158 | 18.0 | 173 | 2.7 | 182 |
| Tonga | 1.9 | 136 | 11.0 | 182 | 9.1 | 158 |
| Trinidad and Tobago | -1,420.1 | 39 | 1,020.2 | 53 | 2,440.3 | 47 |
| Tunisia | 101.6 | 203 | 194.8 | 90 | 93.2 | 119 |
| Turkey | -403.0 | 55 | 3,113.0 | 32 | 3,516.0 | 38 |
| Turkmenistan | -12.5 | 98 | 47.1 | 135 | 59.6 | 127 |
| Turks and Caicos Islands | 48.5 | 187 | 53.6 | 131 | 5.1 | 170 |
| Tuvalu | 0.1 | 116 | 0.1 | 227 | (-) | 228 |
| Uganda | 8.7 | 150 | 24.0 | 162 | 15.3 | 151 |
| Ukraine | -107.6 | 79 | 254.8 | 83 | 362.4 | 79 |
| United Arab Emirates | 2,670.3 | 226 | 3,593.2 | 28 | 922.9 | 65 |
| United Kingdom | -7,540.2 | 16 | 33,204.7 | 4 | 40,744.9 | 6 |
| Uruguay | 15.4 | 159 | 208.6 | 89 | 193.2 | 100 |
| Uzbekistan | 61.4 | 191 | 138.5 | 97 | 77.1 | 122 |
| Vanuatu | -1.9 | 110 | 0.9 | 213 | 2.8 | 181 |
| Vatican City | 1.2 | 132 | 2.9 | 201 | 1.7 | 190 |
| Venezuela | -10,663.8 | 11 | 4,429.7 | 25 | 15,093.5 | 14 |
| Vietnam | -1,814.5 | 31 | 580.2 | 64 | 2,394.7 | 48 |
| Wallis and Futuna | 0.2 | 122 | 0.2 | 222 | (-) | 229 |
| West Bank Administered by Israel | (-) | 115 | 0.3 | 221 | 0.3 | 215 |
| Western Sahara | (-) | 113 | (-) | 230 | (-) | 222 |
| Western Samoa | 1.3 | 133 | 7.6 | 190 | 6.4 | 165 |
| Yugoslavia | 68.5 | 192 | 78.1 | 118 | 9.6 | 156 |
| Zambia | 27.9 | 175 | 35.7 | 142 | 7.9 | 161 |
| Zimbabwe | -53.4 | 90 | 49.3 | 134 | 102.8 | 118 |
| Unidentified | 187.1 | (X) | 187.1 | (X) | (-) | (X) |
| North America | -85,310.5 | (X) | 258,392.9 | (X) | 343,703.4 | (X) |
| Western Europe | -88,938.2 | (X) | 157,029.8 | (X) | 245,968.0 | (X) |
| Euro Area | -66,735.3 | (X) | 105,837.6 | (X) | 172,572.9 | (X) |
| European Union (EU) | -82,080.2 | (X) | 143,691.3 | (X) | 225,771.4 | (X) |
| European Free Trade Association | -6,336.7 | (X) | 9,422.5 | (X) | 15,759.2 | (X) |
| Eastern Europe | -8,300.9 | (X) | 6,596.6 | (X) | 14,897.5 | (X) |
| Former Soviet Republics | -4,505.8 | (X) | 4,111.5 | (X) | 8,617.3 | (X) |
| Organization for Economic | -88,818.3 | (X) | 156,244.7 | (X) | 245,063.0 | (X) |
| Cooperation & Development | ||||||
| (OECD) in Europe | ||||||
| Pacific Rim Countries | -214,903.6 | (X) | 178,569.1 | (X) | 393,472.7 | (X) |
| Asia–Near East | -15,364.6 | (X) | 18,930.0 | (X) | 34,294.6 | (X) |
| Asia–(NICS) | -22,080.2 | (X) | 69,769.9 | (X) | 91,850.1 | (X) |
| Asia—South | -12,888.2 | (X) | 5,335.4 | (X) | 18,223.6 | (X) |
| Assoc. of South East Asia Nations | -34,256.1 | (X) | 41,329.1 | (X) | 75,585.2 | (X) |
| (ASEAN) | ||||||
| APEC | -316,834.3 | (X) | 448,891.8 | (X) | 765,726.0 | (X) |
| South/Central America | -17,952.2 | (X) | 51,551.1 | (X) | 69,503.3 | (X) |
| COUNTRY TRADE BALANCE RANK EXPORTS F . A . S . RANK | IMPORTS | CUSTOMS | RANK | ||
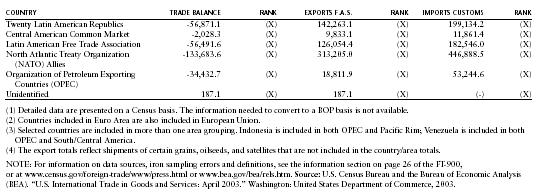
| (1) Detailed data are presented on a Census basis. The information needed to convert to a BOP basis is not available. | |||||
| (2) Countries included in Euro Area are also included in European Union. | |||||
| (3) Selected countries are included in more than one area grouping. Indonesia is included in both OPEC and Pacific Rim; Venezuela is included in both OPEC and South/Central America. | |||||
| (4) The export totals reflect shipments of certain grains, oilseeds, and satellites that are not included in the country/area totals. | |||||
| NOTE: For information on data sources, iron sampling errors and definitions, see the information section on page 26 of the FT-900, or at www.census.gov/foreign-trade/www/press.html or www.bea.gov/bea/rels.htm . Source: U.S. Census Bureau and the Bureau of Economic Analysis (BEA). "U.S. International Trade in Goods and Services: April 2003." Washington: United States Department of Commerce, 2003. | |||||
| Twenty Latin American Republics -56,871.1 (X) 142,263.1 (X) | 199,134.2 | (X) | |||
| Central American Common Market -2,028.3 (X) 9,833.1 (X) | 11,861.4 | (X) | |||
| Latin American Free Trade Association -56,491.6 (X) 126,054.4 (X) | 182,546.0 | (X) | |||
| North Atlantic Treaty Organization -133,683.6 (X) 313,205.0 (X) | 446,888.5 | (X) | |||
| (NATO) Allies | |||||
| Organization of Petroleum Exporting -34,432.7 (X) 18,811.9 (X) | 53,244.6 | (X) | |||
| Countries (OPEC) | |||||
| Unidentified 187.1 (X) 187.1 (X) | (-) | (X) | |||
pressures on the US dollar compelled the government to announce a 10% devaluation against nearly all of the world's major currencies. US international gold reserves thereupon rose from $14.4 billion in 1973 to $15.9 billion at the end of 1974; as of 1999, US gold reserves stood at $75 billion, down from $102 billion in 1990
Despite the decline in the value of the dollar in 2003, the current account was forecast to remain in substantial deficit for 2003/04. The volume of US imports and exports surpasses that of any other country, but exports of goods and services accounted for less than 11% of GDP in 2001.
The US Central Intelligence Agency (CIA) reports that in 2001 the purchasing power parity of the United States' exports was $723 billion while imports totaled $1.15 trillion resulting in a trade deficit of $425 billion.
The International Monetary Fund (IMF) reports that in 2001 the United States had exports of goods totaling $722 million and imports totaling $1.15 trillion. The services credit totaled $276 billion and debit $210 billion. The following table summarizes the United States' balance of payments as reported by the IMF for 2001 in billions of US dollars.
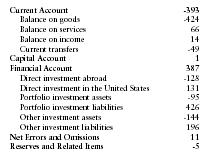
| Current Account | -393 |
| Balance on goods | -424 |
| Balance on services | 66 |
| Balance on income | 14 |
| Current transfers | -49 |
| Capital Account | 1 |
| Financial Account | 387 |
| Direct investment abroad | -128 |
| Direct investment in the United States | 131 |
| Portfolio investment assets | -95 |
| Portfolio investment liabilities | 426 |
| Other investment assets | -144 |
| Other investment liabilities | 196 |
| Net Errors and Omissions | 11 |
| Reserves and Related Items | -5 |
Comment about this article, ask questions, or add new information about this topic: