Cape Verde - Balance of payments
Cape Verde's massive annual trade deficit is only partially offset by remittances from Cape Verdeans employed abroad. Annual payment deficits were substantial and could be met only through foreign assistance. The average import growth rate between 1990 and 1995 was 14%, compared to a GDP growth rate of 4%. Debt in 2000 reached $301 million. Due to foreign investment, largely in free-zone enterprises, exports have risen in recent years. In 1992, banana, lobster, and fresh and frozen fish accounted for 92% of the country's exports, led by banana exports. In contrast, in 1999, shoe parts, shoes, and garments accounted for 76% of exports, led by shoe exports.
The US Central Intelligence Agency (CIA) reports that in 2001 the purchasing power parity of Cape Verde's exports was $273 million while imports totaled $218 million resulting in a trade surplus of $55 million. The International Monetary Fund (IMF) reports that in 1999 Cape Verde had exports of goods totaling $26 million and imports totaling $241 million. The services credit totaled $106 million and debit $117 million. The following table summarizes Cape Verde's balance of payments as reported by the IMF for 1999 in millions of US dollars.
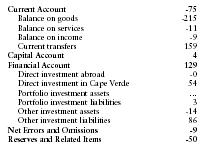
| Current Account | -75 |
| Balance on goods | -215 |
| Balance on services | -11 |
| Balance on income | -9 |
| Current transfers | 159 |
| Capital Account | 4 |
| Financial Account | 129 |
| Direct investment abroad | -0 |
| Direct investment in Cape Verde | 54 |
| Portfolio investment assets | … |
| Portfolio investment liabilities | 3 |
| Other investment assets | -14 |
| Other investment liabilities | 86 |
| Net Errors and Omissions | -9 |
| Reserves and Related Items | -50 |
Comment about this article, ask questions, or add new information about this topic: