Cameroon - Balance of payments
In the late 1970s, increased oil production compensated for the low world market prices of Cameroon's agricultural exports and helped the country achieve a favorable balance of payments. From 1994 to 1997, the volume and value of Cameroon's exports increased annually, in part due to the CFA currency devaluation. Since 1997, Cameroon was able to finance it's debt, which reached $8.7 billion in 1998. As of the early 2000s, cocoa and lumber exports had declined, due in part to lower world commodity prices. Petroleum remains Cameroon's chief export commodity. Cameroon has been attempting to attract further foreign investment into offshore and onshore concessions to raise export earnings. Cameroon imports primarily semiprocessed products and other industrial goods, machinery, and food products.
The US Central Intelligence Agency (CIA) reports that in 2000 the purchasing power parity of Cameroon's exports was $2.1 billion while imports totaled $1.5 billion resulting in a trade surplus of $600 million.
The International Monetary Fund (IMF) reports that in 1995 Cameroon had exports of goods totaling $1.74 billion and imports totaling $1.11 billion. The services credit totaled $304 million and debit $499 million. The following table summarizes Cameroon's balance of payments as reported by the IMF for 1995 in millions of US dollars.
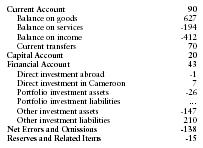
| Current Account | 90 |
| Balance on goods | 627 |
| Balance on services | -194 |
| Balance on income | -412 |
| Current transfers | 70 |
| Capital Account | 20 |
| Financial Account | 43 |
| Direct investment abroad | -1 |
| Direct investment in Cameroon | 7 |
| Portfolio investment assets | -26 |
| Portfolio investment liabilities | … |
| Other investment assets | -147 |
| Other investment liabilities | 210 |
| Net Errors and Omissions | -138 |
| Reserves and Related Items | -15 |