Russia - Foreign trade
Principal exports have traditionally been oil (accounting for about 33% of earnings), gas, minerals, military equipment and weapons, gold, shipping, and transport services. Principal imports include machinery and equipment, consumer goods, medicines, meat, grain, sugar, and semi-finished metal products.
In 2000 the Russian Federation's imports were distributed among the following categories:
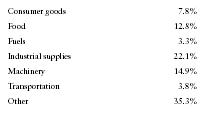
| Consumer goods | 7.8% |
| Food | 12.8% |
| Fuels | 3.3% |
| Industrial supplies | 22.1% |
| Machinery | 14.9% |
| Transportation | 3.8% |
| Other | 35.3% |
Imports and exports to principal trading partners in 2000 (in millions of US dollars) were as follows:
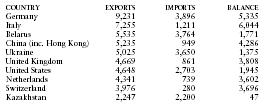
| COUNTRY | EXPORTS | IMPORTS | BALANCE |
| Germany | 9,231 | 3,896 | 5,335 |
| Italy | 7,255 | 1,211 | 6,044 |
| Belarus | 5,535 | 3,764 | 1,771 |
| China (inc. Hong Kong) | 5,235 | 949 | 4,286 |
| Ukraine | 5,025 | 3,650 | 1,375 |
| United Kingdom | 4,669 | 861 | 3,808 |
| United States | 4,648 | 2,703 | 1,945 |
| Netherlands | 4,341 | 739 | 3,602 |
| Switzerland | 3,976 | 280 | 3,696 |
| Kazakhstan | 2,247 | 2,200 | 47 |
Comment about this article, ask questions, or add new information about this topic: