Finland - Balance of payments
The trade surplus reached a new record in 2000, totaling $13.3 billion, and the ratio of the trade account surplus to GDP rose10.9%. The interest-bearing net foreign debt decreased in 2000, reaching a low level in June 2000 of $6.5 billion.
Finnish households and businesses became more cautious in spending, due to the deep recession in the early 1990s and the slowdown in the global economy that began in 2001. Nonetheless, the financial health of Finnish companies improved in the late 1990s and into the 2000s, and private consumption was forecast to increase by 3.5% in 2000. Investment outflows exceed direct investment in Finland; foreigners are more interested in portfolio investments. Some changes in taxes, the promotion of Finland as a gateway for Russian markets, and the country's membership in the EU might attract foreign investment, however.
The US Central Intelligence Agency (CIA) reports that in 2002 the purchasing power parity of Finland's exports was $40.1 billion while imports totaled $31.8 billion resulting in a trade surplus of $8.3 billion.
The International Monetary Fund (IMF) reports that in 2001 Finland had exports of goods totaling $43 billion and imports totaling $30.2 billion. The services credit totaled $5.8 billion and debit $8.2 billion. The following table summarizes Finland's balance of payments as reported by the IMF for 2001 in millions of US dollars.
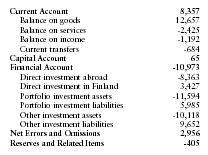
| Current Account | 8,357 |
| Balance on goods | 12,657 |
| Balance on services | -2,425 |
| Balance on income | -1,192 |
| Current transfers | -684 |
| Capital Account | 65 |
| Financial Account | -10,973 |
| Direct investment abroad | -8,363 |
| Direct investment in Finland | 3,427 |
| Portfolio investment assets | -11,594 |
| Portfolio investment liabilities | 5,985 |
| Other investment assets | -10,118 |
| Other investment liabilities | 9,652 |
| Net Errors and Omissions | 2,956 |
| Reserves and Related Items | -405 |
Comment about this article, ask questions, or add new information about this topic: