Belgium - Balance of payments
Belgium-Luxembourg ran deficits on current accounts each year from 1976 through 1984. Trade deficits, incurred consistently in the late 1970s and early 1980s, were only partly counterbalanced by invisible exports, such as tourism and services, and capital transfers. The Belgian franc is equivalent at par with the Luxembourg franc; the two nations formed the Belgian-Luxembourg Economic Union (BLEU) in 1921. Belgium ranks among the top 10 trading nations in the world.
Belgium in the early 2000s was making progress on meeting the EU's Maastricht target of a cumulative public debt of not more than 60% of GDP. Belgium has one of the highest current account surpluses of all OECD countries, at 5% of GDP.
The US Central Intelligence Agency (CIA) reports that in 2002 the purchasing power parity of Belgium's exports was $162 billion while imports totaled $152 billion resulting in a trade surplus of $10 billion.
The International Monetary Fund (IMF) reports that in 2001 Belgium had exports of goods totaling $163 billion and imports totaling $159.3 billion. The services credit totaled $44.5 billion and debit $40 billion. The following table summarizes Belgium's balance of payments as reported by the IMF for 2001 in millions of US dollars.
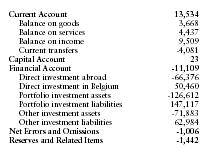
| Current Account | 13,534 |
| Balance on goods | 3,668 |
| Balance on services | 4,437 |
| Balance on income | 9,509 |
| Current transfers | -4,081 |
| Capital Account | 23 |
| Financial Account | -11,109 |
| Direct investment abroad | -66,376 |
| Direct investment in Belgium | 50,460 |
| Portfolio investment assets | -126,612 |
| Portfolio investment liabilities | 147,117 |
| Other investment assets | -71,883 |
| Other investment liabilities | 62,984 |
| Net Errors and Omissions | -1,006 |
| Reserves and Related Items | -1,442 |
Comment about this article, ask questions, or add new information about this topic: