Turkey - Foreign trade
Turkey's trade balance has long been negative, but the deficit reached crisis proportions in 1974/75 and again in 1980/81, when import value was nearly double that of exports and the annual trade deficit approached $5 billion. In 1985, the government mandated the creation of four free trade and export processing zones aimed at expansion and diversification of exports. By 1990, the deficit had risen to over $9 billion and the ratio of exports to imports fell to 58%, compared to 81% in 1988. The gap narrowed slightly in 1991 and 1992, but widened in 1993. Exports have increased from $18.1 billion in 1994 to $21.6 billion in 1995 to $24.5 billion in 1996. Total imports in 1994 amounted to $23.3 billion, and rose to $35.7 billion in 1995 and $45 billion in 1996. Since 1994, strong domestic demand has caused imports to surge, along with the reduction of import duties that accompanied the introduction of the customs union in 1996. By 2000, exports equaled only slightly more than half of imports (50.8%), bringing back memories of trade balances of the 1970s and '80s.
The garment and textile industry in Turkey accounts for the largest amount of commodity exports (37%). Other exports include iron and steel (6.8%), fruits and nuts (3.6%), and televisions (3.0%).
In 2000 Turkey's imports were distributed among the following categories:
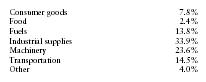
| Consumer goods | 7.8% |
| Food | 2.4% |
| Fuels | 13.8% |
| Industrial supplies | 33.9% |
| Machinery | 23.6% |
| Transportation | 14.5% |
| Other | 4.0% |
Principal trading partners in 2000 (in millions of US dollars) were as follows:
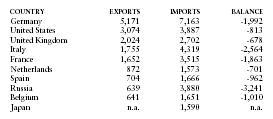
| COUNTRY | EXPORTS | IMPORTS | BALANCE |
| Germany | 5,171 | 7,163 | -1,992 |
| United States | 3,074 | 3,887 | -813 |
| United Kingdom | 2,024 | 2,702 | -678 |
| Italy | 1,755 | 4,319 | -2,564 |
| France | 1,652 | 3,515 | -1,863 |
| Netherlands | 872 | 1,573 | -701 |
| Spain | 704 | 1,666 | -962 |
| Russia | 639 | 3,880 | -3,241 |
| Belgium | 641 | 1,651 | -1,010 |
| Japan | n.a. | 1,590 | n.a. |
Comment about this article, ask questions, or add new information about this topic: