Japan - Foreign trade
Foreign trade remains essential to the Japanese economy. Imports consist mostly of fuel, foodstuffs, industrial raw materials, and industrial machinery. Exports are varied, but manufactures now account for nearly all of the total. Cars represent a leading export product, with the United States, Canada, Australia, Germany and the United Kingdom as the main markets. The export of office machinery, scientific and optical equipment is also important. South Korea, China, and Taiwan are among the main buyers of Japan's iron and steel, while plastic materials and fertilizers are shipped primarily to South Korea and the Southeast Asian countries, and woven fabrics are supplied to China, the United States, Hong Kong, and Sa'udi Arabia. Only a small fraction of Japan's total exports (around 0.5%) consists of food items, mainly fish.
In light of growing overseas concern about Japan's continuing large trade surplus, the US and Japanese governments collaborated on the Structural Impediments Initiative of 1989. Steps taken in the wake of the Initiative's 1990 report have included a variety of import and direct foreign investment promotion measures, including deregulation, accelerated government spending on public infrastructure, and support services for foreign businesses.
Manufactured products make up most of Japan's commodity exports, and 15% of the world's total manufactured exports. The automobile is the country's most important industry (12%), along with computers and electronic equipment (6.6%). Japan also makes 26% of the world's exported ships. The top 10 exports of 2000 were:
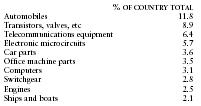
| % OF COUNTRY TOTAL | ||
| Automobiles 11.8 | ||
| Transistors, valves, etc | 8.9 | |
| Telecommunications equipment | 6.4 | |
| Electronic microcircuits | 5.7 | |
| Car parts | 3.6 | |
| Office machine parts | 3.5 | |
| Computers | 3.1 | |
| Switchgear | 2.8 | |
| Engines | 2.5 | |
| Ships and boats | 2.1 |
In 2000 Japan's imports were distributed among the following categories:
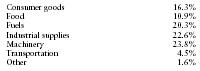
| Consumer goods | 16.3% |
| Food | 10.9% |
| Fuels | 20.3% |
| Industrial supplies | 22.6% |
| Machinery | 23.8% |
| Transportation | 4.5% |
| Other | 1.6% |
Principal trading partners in 2000 (in millions of US dollars) were as follows:
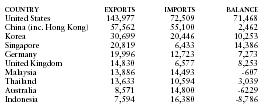
| COUNTRY | EXPORTS | IMPORTS | BALANCE |
| United States | 143,977 | 72,509 | 71,468 |
| China (inc. Hong Kong) | 57,562 | 55,100 | 2,462 |
| Korea | 30,699 | 20,446 | 10,253 |
| Singapore | 20,819 | 6,433 | 14,386 |
| Germany | 19,996 | 12,723 | 7,273 |
| United Kingdom | 14,830 | 6,577 | 8,253 |
| Malaysia | 13,886 | 14,493 | -607 |
| Thailand | 13,633 | 10,594 | 3,039 |
| Australia | 8,571 | 14,800 | -6229 |
| Indonesia | 7,594 | 16,380 | -8,786 |
Comment about this article, ask questions, or add new information about this topic: