Indonesia - Public finance
Government expenditures (including capital expenditures) have outrun public income by a considerable margin each year since 1952, and this cash deficit has been met by foreign aid receipts. Since 1985, however, Indonesia has discouraged public sector and monetary growth, resulting in an overall budgetary surplus in 1991/92, despite a significant drop in oil revenues from falling prices. The East Asian financial crisis of 1998 hit Indonesia hard. In 1998, the government deficit reached over 3% of GDP, partially because of subsidized rice imports and investment in the failing banking sector. As of 2002, the economy was just beginning to recover to pre-1997 levels, and the growth rate was not considered high enough to achieve full employment anytime soon. At the end of 2001, Indonesia's external debt was the equivalent of 20% of total GDP.
The US Central Intelligence Agency (CIA) estimates that in 2000 Indonesia's central government took in revenues of approximately $26 billion and had expenditures of $30 billion. Overall, the government registered a deficit of approximately $4 billion. External debt totaled $135 billion.
The following table shows an itemized breakdown of government revenues and expenditures. The percentages were calculated from data reported by the International Monetary Fund. The dollar amounts (millions) are based on the CIA estimates provided above.
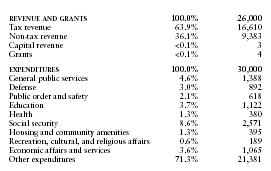
| REVENUE AND GRANTS | 100.0% | 26,000 |
| Tax revenue | 63.9% | 16,610 |
| Non-tax revenue | 36.1% | 9,383 |
| Capital revenue | <0.1% | 3 |
| Grants | <0.1% | 4 |
| EXPENDITURES | 100.0% | 30,000 |
| General public services | 4.6% | 1,388 |
| Defense | 3.0% | 892 |
| Public order and safety | 2.1% | 618 |
| Education | 3.7% | 1,122 |
| Health | 1.3% | 380 |
| Social security | 8.6% | 2,571 |
| Housing and community amenities | 1.3% | 395 |
| Recreation, cultural, and religious affairs | 0.6% | 189 |
| Economic affairs and services | 3.6% | 1,065 |
| Other expenditures | 71.3% | 21,381 |
Comment about this article, ask questions, or add new information about this topic: