Indonesia - Foreign trade
Trade balances since World War II have invariably been favorable. Trade liberalization began in 1982 as an effort to increase non-oil exports. By 1987, non-oil exports matched revenue from oil and gas exports for the first time. Imports, which are closely regulated in government efforts to restrain growth of merchandise imports, consist mainly of machinery and raw materials, indicating a reliance on imports to support industry. Discrepancies in trade figures are common and reflect widespread smuggling and corruption of customs and government officials. The late 1990s revealed shrinking exports of plywood, and slow growth in exports of garments and textiles. Emerging exports such as footwear and consumer electronics also showed weak growth. However, rising world prices for oil (except in 1997 and 1998), rubber, and other commodities kept these exports high. The surge in non-oil imports owes much to the demand for consumer goods. In 1998, Indonesia was the world's largest rice importer due to drought, and imported little else. Economic, political, and social crisis was accompanied by a small leap in exports due to currency depreciation, but earnings in the non-oil sector remained low nonetheless.
In the 1970s, Japan became Indonesia's dominant trade partner taking over 41% of Indonesia's exports (mainly petroleum) and supplying over 25% of its imports. Although Japan remains the dominant trade partner, other trade partners— including the US, Singapore, and China—have become important to the economy. Trade with the Netherlands, which was of primary importance in colonial times when Indonesia was known as the Dutch East Indies, has decreased since 1957. With the creation in 1992 of the ASEAN Free Trade Area (AFTA), trade within the region has increased.
Indonesia puts out a large amount of gas (10.6% of country exports, 8.0% of world exports) and crude petroleum (9.8%) into its commodities export market. Other major exports include apparel (7.7%), textiles (5.7%), paper products (3.7%), plywood (3.2%), footwear (2.6%), and copper ore (2.6%).
In 2000 Indonesia's imports were distributed among the following categories:
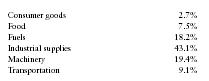
| Consumer goods | 2.7% |
| Food | 7.5% |
| Fuels | 18.2% |
| Industrial supplies | 43.1% |
| Machinery | 19.4% |
| Transportation | 9.1% |
Principal trading partners in 2000 (in millions of US dollars) were as follows:
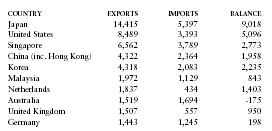
| COUNTRY | EXPORTS | IMPORTS | BALANCE |
| Japan | 14,415 | 5,397 | 9,018 |
| United States | 8,489 | 3,393 | 5,096 |
| Singapore | 6,562 | 3,789 | 2,773 |
| China (inc. Hong Kong) | 4,322 | 2,364 | 1,958 |
| Korea | 4,318 | 2,083 | 2,235 |
| Malaysia | 1,972 | 1,129 | 843 |
| Netherlands | 1,837 | 434 | 1,403 |
| Australia | 1,519 | 1,694 | -175 |
| United Kingdom | 1,507 | 557 | 950 |
| Germany | 1,443 | 1,245 | 198 |