India - Industry
Modern industry has advanced fairly rapidly since independence, and the industrial sector now contributes 26.9% of the GDP. Large modern steel mills and many fertilizer plants, heavy machinery plants, oil refineries, locomotive and automotive works have been constructed; the metallurgical, chemical, cement, and oil-refining industries have also expanded. Moreover, India has established its role in the high value-added sectors of the "new economy" sectors of information technology (IT), computer hardware, computer software, media and entertainment. Yet, though the total product is large, industry absorbs only about 17% of the labor force. Nine states— Maharashtra, West Bengal, Tamil Nadu, Gujarat, Uttar Pradesh, Bihar, Andhra Pradesh, Karnataka, and Madhya Pradesh— together account for most of Indian industry.
Industrial production expanded at an average annual rate of 5– 6% between 1970 and 1990. Enforced austerity and demand management measures taken to stabilize rapidly worsening macroeconomic imbalances in 1991–92 slowed growth in the industry sector to 0% for that year. This was followed by a modest recovery to 1.9% growth in 1992–93, though declining to an estimated 1.6% in 1993–94, due to lingering effects of the earlier stabilization measures as well as poorer than expected demand in key export markets. In 1995–96, however, the index of industrial production (IIP) jumped 11.7%, led by a 13% increase in manufacturing output, the highest in 25 years. Growth in industrial production was 6.6% in 1997/98, but slowed to 4.1% in 1998/99 primarily due to the effects of the Asian financial crisis, but also in part to international sanctions imposed after its nuclear tests in 1998. A rebound evidenced in6.6% growth in 1999/00 was cut short by the global slowdown in 2001, and the aftermath of the 11 September 2001 terrorist attacks on the United States, including intensifying regional tensions with Pakistan. Growth in industrial production slowed, to 5.1% in 2000/01 and to 2.7% in 2001/02.
Under the planned development regime of past decades, government directives channeled much of the country's resources into public enterprises. Private investment was closely regulated for all industries, discouraging investors from formal entry into the sector. However, industrial policy in recent years has shifted towards privatization and deregulation. Since 1991 government licensing requirements have been abolished for all but a few "controlled areas": distillation and brewing of alcoholic drinks, cigars and cigarettes, defense equipment, industrial explosives, hazardous chemicals, and drugs and pharmaceuticals. Under the government disinvestment program announced at the end of 1999, only three sectors remain completely closed to private investment: defense, atomic energy, ad railway transport. The oil industry was opened to joint foreign investment in 1997 under the New Exploration and Licensing Policy (NELP). The first exploration blocks were auctioned off in two rounds in 2000, but the initiative none of the major international oil companies put in bids. The Ministry of Disinvestment was established in December 1999 to oversee the reduction of government shares in 247 state-owned companies, referred to as public sector units (PSUs), to a 26% stake. The first sale, in early 2000, was 51% of the Bharat Aluminum Company, Ltd. to Sterlite Ltd. of India. In May 2002, managerial control of Maruti Udyog Ltd. (MUL), India's top carmaker claiming a 60% market share, was transferred to Suzuki Maintenance Corporation (SMC) of Japan, one of the few foreign buyers in the disinvestment program to date. SMC was already MUL's technology provider in their joint venture and owned a 46% share of MUL. SMC took control by buying an additional 5% for about $213 million, a move it had previously declined to take. The government plans to offer the rest of its shares on the stock market in 2004. Generally, the PSUs for which the government has found buyers in its disinvestment program have not been in the industrial or manufacturing sectors. Instead, the government has also steps to make their operations more competitive. In 2001, for instance, quantitative restrictions (QRs) were removed from about 715 imports, including cars, clothes watches, pins, dairy products, part of the accession process to the WTO. Credit and capital markets have also been greatly liberalized. Since 1992, all foreign companies have been on par with Indian companies in the area of foreign exchange solvency and on the stock market. With these reforms, private investment in industry is now proceeding at a steady if still modest pace, fostering increased competition in most of the mining and manufacturing sectors previously monopolized by parastatals. In 2001/02 net foreign direct investment (FDI) and net portfolio investment combined equaled $6.3 billion, the highest on record.
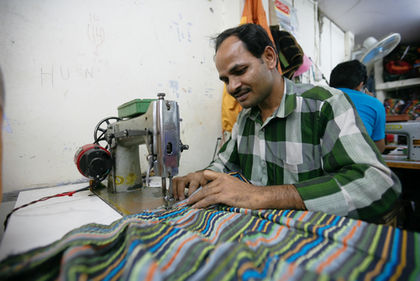
Textile production dominates the industrial field, accounting for about 30% of export earnings while adding only 7% to 8% to imports. The textile industry employs approximately 35 million workers, making it the second-largest employer in India after agriculture. The sector is highly fragmented, containing about 7000 operational units encompassing a $2.9 billion clothing industry, a $16.3 billion finished fabrics industry, a $1.9 billion industrial textile products industry, and a $600 million household textile products industry. On a broad level it can also be divided between the natural fiber segment (cotton, silk, wool, jute, etc.) and the man-made fiber segment (polyester filament yarn, blended yarns, etc.). Cotton accounts for about 60% of both domestic consumption and exports. In terms of operations, since the 1980s decentralized powerlooms have produced an increasingly large share of production as centralized mills have declined. In 1986, there were about 638,000 decentralized powerlooms in operation, and by 2002 these had increased 260% to about 1,662,000, including an estimated 1,227,000 conventional shuttle looms, 400,000 drop-box semi-automatic looms, 30,000 automatic looms and 5,000 shuttleless looms (most second-hand imports). Anticipating the globalization of the textile market in 2004 when the multifiber agreement (MFA) is scheduled to be phased out, India's National Textile Policy-2000 has pinpointed the weaving sector as the crucial link in the textile value chain (from fiber to fabric to garment to style) that needs to become more competitive. The Textile Program, announced in the budget for 2001/02, included a program for modernizing the powerloom sector through the introduction of 50,000 shuttleless looms and 250,000 semiautomatic looms. The union budget for 2002/03 continued the program, adding an array of tax and duty exemptions for the benefit of powerloom operators. In 2002/03, the Office of the Textile Commissioner estimated that decentralized powerlooms accounted for 76.8% of cloth production (including hosiery); hand looms, 18%; mills, 3.7%; and others, 1.5%. By contrast, integrated mill operations, which perform spinning, weaving and processing in a central location, have stagnated and declined. In December 2002, 464 mills were closed compared to 220 in 1999/98, and hundreds more were slated for closure in 2003. There were 1,782 cotton and man-made fiber mills in 1999, only 192 of them were publicly owned. Mumbai (formerly Bombay), Ahmadabad, and the provincial cities in southern India lead in cotton milling, which accounts for about 65% of the raw material consumed by the textile industry. Jute milling is localized at Calcutta, center of the jute agricultural area. India is the world's number one jute manufacturer. On average, textile production has been growing about 5% a year, although in 2001–02, with demand damped by a series of negative events—economic recession in the United States, a global economic slowdown, the 11 September 2001 terrorist attacks on the United States, the attack on India's Parliament 13 December 2001 and sectarian violence in Gujarat—growth fell to2.6%, compared with 4.4% in 2000/01, while textile exports fell 9%. However, by the end of 2002 and continuing into 2003 strong growth was evidenced. The production of textile products, including ready-made garments, grew 17% during the first quarter of 2003 year-on-year (YOY) and textile exports grew8.48%.
India is the world's tenth-largest steel producer. In 2001/02, according to the Ministry of Steel, it produced 4.08 million tons of pig iron (up 19.8%) and 30.64 million tons of finished steel (up 4.7%). The industry consists of seven large integrated mills and about 180 mini steel plants. Despite some signs of recovery 2002, all the major steel companies except the Tata Steel Corporation, the largest and oldest (founded in 1907), were facing serious financial problems due to overcapacity, cheap imports, and anti-dumping duties imposed by the United States in June 2001 that affected Indian exports. Nevertheless, during 2002 steel experienced a strong revival due to rising steel prices, increased domestic demand mainly from highway construction projects, and a 15.88% YOY rise in exports April to November 2002. The metallurgical sector also produced 818,000 tons of aluminum products, up from 640,000 tons in 1998/99. Automobile production, fed by both the steel and aluminum industries, has grown at an annual rates of close to 20% since liberalization in 1993, propelled by low interest rates, the expansion of consumer finance, and strong export demand. In 2002, 90.2% of vehicles produced were economy cars, and 9.8% were luxury cars and SUVs. From 1999/2000 to 2001/02, total production of cars, utility vehicles and commercial vehicles declined 4.7% from 875,179 to 834,071, while the production of two-wheelers increased 14.4%, from about 4.8 million to 5.47 million. Exports of all kinds of vehicles totaled 215,318 April to December 2002, a 68% YOY increase.
In the field of computers and consumer electronics production has been boosted by the liberalization of technology and component imports. In consumer durables, production in many cases grew at double-digit rates in 2002/02 (air conditioners, 25%; microwave ovens, over 20%; color TVs, over 15%, refrigerators, 12%; audio products and DVDs, 10%; washing machines, less than 5%), while computer production was up 36%. Computer software exports have grown as a compound growth rate of 50% per year for the past five years. In 2001/02, electronics hardware exports reached $1.253 billion, up 22.6% over 2001/02, while computer software exports reached $7.8 billion, up 28.7%.
In the petrochemical sector, India has 18 refineries throughout the country with a total refinery capacity of more that two million barrels per day. Sixteen refineries are government-owned, one is jointly owned, and one, the 540,000-barrels-per-day Reliance Industries refinery at Jamnagar in Gujarat State, is privately owned. Almost half India's refinery capacity—now at 970,000 barrels per day—has been built since 1998, the government's goal being self-sufficiency in refined petroleum products. India's total refinery capacity should currently be enough to meet domestic demand, but because of operational problems it still has to import diesel fuel.
India's cement industry is the second-largest in the world, after China, with an installed capacity of 135 million tons as of March 2002. Exports have been very limited and only to immediate neighbors. The cement industry is highly fragmented, consisting of 120 large plants and 56 companies. In the last decade, government's portion of cement consumption decreased from 50% to 35% as the domestic housing market has grown. However, government financed infrastructure projects also helped sparked a growth in construction of about 9.7% YOY April to December 2002. In 2001/02, 106.9 million tons of cement were produced, of which 5.14 million tons were exported.
Like cement, India's food processing industry in oriented mainly toward the domestic market. It is India's fifth largest industry, with output reaching $31 billion food in 2001/02. Structurally it consists of about 9000 operational units, accounts for about 6.3% of GDP, 13% of exports, and 18% of industrial employment (about 1.6 million workers).
India's fertilizer industry is the third largest in the world, and central to its efforts to increase agricultural productivity. The industry consists of 64 large fertilizer plants (39 producing urea, the most affordable fertilizer and 18 manufacturing diammonium phosphate or DAP, and other products), and 79 small and medium plants. As of 2000, installed capacity in nitrogen-based nutrients was 11 million tons and in phosphate-based nutrients, 3.6 million tons. Potassium-based nutrients must all be imported. Since 1992 the government has been gradually decontrolling the price of fertilizers. The prices of urea are scheduled to be completely decontrolled by 2006/07.
Overall industrial production grew at 2.7% in 2001/02, its weakest performance since the early 1990s. Manufacturing, accounting for about 80% of the sector, grew 2.9%, while the electricity segment increased 3.1% and mining only 1.2%. Figures for April to November 2002 showed signs of recovery, however, with a 5.3% YOY increase for industrial production overall, and 5.4% YOY growth in manufacturing.