China - Public finance
The annual state budget is prepared by the Ministry of Finance and approved by the National People's Congress. A major reform in public finance, introduced in 1980, was a new system of allocating revenues and expenditures between local and national levels of government. Previous revenue-sharing procedures allowed the central government to fix maximum spending levels for each province, autonomous region, and centrally administered municipality. The new system fixed for a five-year period the proportion of local income to be paid to the central government and (except for emergency appropriations for floods and other such disasters) the level of subsidies to be provided by the central government, as well as the proportion of local income to be retained by local governments. Autonomous regions receive proportionately greater state subsidies than the provinces and centrally administered municipalities, and they are entitled to keep all revenues from local industrial and commercial taxes.
During the 1990s, the Chinese consolidated budget deficit grew at a rapidly increasing rate. According to the IMF, the 1998 budget deficit amounted to 4% of GDP, due to rising expenditures and tax evasion. Deficits are largely financed by domestic debt issuance rather than by money creation. In 1999, the central government performed an audit of embezzlement, finding that some $2.4 billion in state funds had been diverted into private bank accounts, and that a total equaling one-fifth of the central government's tax revenues were misused. In all, the government's liabilities were equal to 100% of GDP in 2000, according to some sources. Annual tax revenues equal 13% of GDP, one-fifth of which goes annually to paying interest on government debts.
The US Central Intelligence Agency (CIA) estimates that in 2000 China's central government took in revenues of approximately $161.8 billion and had expenditures of $191.8 billion. Overall, the government registered a deficit of approximately $30 billion. External debt totaled $149.4 billion.
The following table shows an itemized breakdown of government revenues and expenditures. The percentages were calculated from data reported by the International Monetary Fund. The dollar amounts (millions) are based on the CIA estimates provided above.
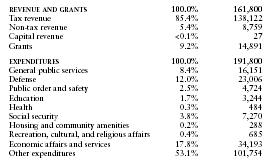
| REVENUE AND GRANTS | 100.0% | 161,800 |
| Tax revenue | 85.4% | 138,122 |
| Non-tax revenue | 5.4% | 8,759 |
| Capital revenue | <0.1% | 27 |
| Grants | 9.2% | 14,891 |
| EXPENDITURES | 100.0% | 191,800 |
| General public services | 8.4% | 16,151 |
| Defense | 12.0% | 23,006 |
| Public order and safety | 2.5% | 4,724 |
| Education | 1.7% | 3,244 |
| Health | 0.3% | 484 |
| Social security | 3.8% | 7,270 |
| Housing and community amenities | 0.2% | 288 |
| Recreation, cultural, and religious affairs | 0.4% | 685 |
| Economic affairs and services | 17.8% | 34,193 |
| Other expenditures | 53.1% | 101,754 |