China - Foreign trade
Though China has only recently become a major trading nation, its enormous trading potential is attracting great attention by both advanced and newly industrializing nations, shown by the world's interest in China's membership with the WTO. Trade has performed important functions within the economy, providing needed capital goods and modern technology to abet development, as well as primary commodities (such as grains) to supplement local supply in slack years. Foreign trade is under the direction of a single Ministry of Foreign Economic Relations and Trade, created in 1982 through the merger of the former ministries of Foreign Trade and Foreign Economic Relations with the Export-Import and Foreign Investment commissions. A major issue since the early 1980s, however, has been the decentralization of trade management and greater reliance on currency devaluation (major devaluations were implemented in 1989 and 1991) and market incentives rather than direct export and import controls to promote desired trade patterns. After the Asian financial crisis of 1998, officials were tempted to devalue the currency once more; instead the Ministry of Foreign Trade and Economics (MOFTEC) spent massive sums of money on state industry, while dismantling trade barriers in anticipation of WTO membership.
Prior to 1949, some three-fourths of China's exports were agricultural products. This proportion ebbed to a low of 13% during the agricultural crisis of 1961. Foodstuffs and other primary products including crude nonfood raw materials, minerals and fuels averaged about 43% to 50% of exports through 1985, after which the proportion declined steadily to reach only 6% in 1998, as manufactured exports expanded rapidly. Textiles (excluding garments) accounted for 10% of all exports in 1994 and clothing for about 19.7% (up from 7.5% in 1985). However, China's efforts to emulate the success of Japan, British Hong Kong, Taiwan, and the ROK in basing economic expansion on textile and clothing exports have encountered protectionist resistance from major potential markets in the United States and European Union.
The textile and clothing industry created the large majority of China's commodity exports in 1998. China's special administrative region of Hong Kong also produces clothes for a large percentage of its export market (12%), averaging 12.1% of the world's total clothes exports. The majority of Hong Kong's exports go to China. Other exports include electrical parts (16%), watches and clocks (2.6%), telecommunications equipment (6.7%), and footwear (3.0%). Hong Kong produces 28% of the world's exports in watches and clocks. China's top 10 exports (excluding Hong Kong) are as follows:
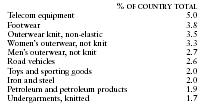
| % OF COUNTRY TOTAL | |
| Telecom equipment | 5.0 |
| Footwear | 3.8 |
| Outerwear knit, non-elastic | 3.5 |
| Women's outerwear, not knit | 3.3 |
| Men's outerwear, not knit | 2.7 |
| Road vehicles | 2.6 |
| Toys and sporting goods | 2.0 |
| Iron and steel | 2.0 |
| Petroleum and petroleum products | 1.9 |
| Undergarments, knitted | 1.7 |
Food imports, which made up only about 2% of the import volume in the 1950s, averaged 20% of the total in 1973 and 1974 but, as total imports rose, fell to less than 4% by 1985 and remained at 2.4% in 1994 and 5% in 1998. In 2000 China's imports were distributed among the following categories:
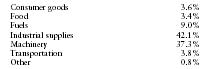
| Consumer goods | 3.6% |
| Food | 3.4% |
| Fuels | 9.0% |
| Industrial supplies | 42.1% |
| Machinery | 37.3% |
| Transportation | 3.8% |
| Other | 0.8% |
The direction of China's trade has followed three major patterns since the 1930s. Prior to World War II, Japan, Hong Kong, the United States, and the United Kingdom together made up about three-fourths of the total trade volume. With the founding of the PRC in 1949, trade shifted in favor of the former USSR and Eastern Europe. During 1952–55, more than 50% of China's trade was with the former USSR; during 1956–60, the proportion averaged about 40%. As Sino-Soviet relations deteriorated during the 1960s, trade exchanges steadily declined, reaching a bare 1% of China's total volume in 1970 (3.6% in 1986). By the early 1980s, most of China's leading trade partners were industrialized non-Communist countries, and China's trade pattern overall reflected a high degree of multilateralism.
In recent years, as China has rapidly enlarged its role on the international market, the importance of Hong Kong as an entrepot and major source of revenue has increased. In 1992, Hong Kong accounted for close to 35% of China's total trade (up from about 21% in 1986). Hong Kong reverted to Chinese rule in 1998, but because of its enormous trade activity, Hong Kong's trade is often measured separate from China. During the 1990s, Japan ranked as the second largest trading partner, importing oil and other raw material and claiming 15% of China's total trade. The most dramatic change in the mid-1980s was the emergence of the United States as China's third-largest trading partner; by 2000 the United States was China's second-largest trading partner, and the largest importer of Chinese goods.
Principal trading partners in 2000 (in millions of US dollars) were as follows:
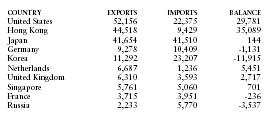
| COUNTRY | EXPORTS | IMPORTS | BALANCE |
| United States | 52,156 | 22,375 | 29,781 |
| Hong Kong | 44,518 | 9,429 | 35,089 |
| Japan | 41,654 | 41,510 | 144 |
| Germany | 9,278 | 10,409 | -1,131 |
| Korea | 11,292 | 23,207 | -11,915 |
| Netherlands | 6,687 | 1,236 | 5,451 |
| United Kingdom | 6,310 | 3,593 | 2,717 |
| Singapore | 5,761 | 5,060 | 701 |
| France | 3,715 | 3,951 | -236 |
| Russia | 2,233 | 5,770 | -3,537 |