Australia - Public finance
The fiscal year begins 1 July and ends 30 June. After World War II, the Commonwealth government assumed greater responsibility for maintaining full employment and a balanced economy, as well as for providing a wide range of social services. Social security and welfare payments are the largest category of government expenditure. The central government has financed almost all its defense and capital works programs from revenue and has made available to the states money raised by public loans for public works programs. Deficits are common. In the latter half of the 1980s, however, five consecutive years of significant surpluses occurred as a result of expenditure restraints. The late 1990s also saw consistent surpluses. In 2000, the government implemented a 10% goods and services tax (GST) on all items, while income tax and corporate tax rates were cut.
The US Central Intelligence Agency (CIA) estimates that in 2000/2001 Australia's central government took in revenues of approximately $86.8 billion and had expenditures of $84.1. Overall, the government registered a surplus of approximately $2.7 billion. External debt totaled $176.8 billion.
The following table shows an itemized breakdown of government revenues and expenditures. The percentages were calculated from data reported by the International Monetary Fund. The dollar amounts (millions) are based on the CIA estimates provided above.
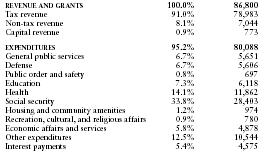
| REVENUE AND GRANTS | 100.0% | 86,800 |
| Tax revenue | 91.0% | 78,983 |
| Non-tax revenue | 8.1% | 7,044 |
| Capital revenue | 0.9% | 773 |
| EXPENDITURES | 95.2% | 80,088 |
| General public services | 6.7% | 5,651 |
| Defense | 6.7% | 5,606 |
| Public order and safety | 0.8% | 697 |
| Education | 7.3% | 6,118 |
| Health | 14.1% | 11,862 |
| Social security | 33.8% | 28,403 |
| Housing and community amenities | 1.2% | 974 |
| Recreation, cultural, and religious affairs | 0.9% | 780 |
| Economic affairs and services | 5.8% | 4,878 |
| Other expenditures | 12.5% | 10,544 |
| Interest payments | 5.4% | 4,575 |
Comment about this article, ask questions, or add new information about this topic: