Venezuela - Foreign trade
Since 1950, Venezuelan foreign trade has gone through a number of bust and boom phases linked with oil prices. The first, between 1950 and 1957, was marked by the maturation of the new oil industry and high demand. The second, from the late 1950s through the 1960s, was characterized by a decline in world petroleum prices and a general drop in investment; during this period, exports of iron ore became increasingly important. The third phase, beginning in the early 1970s, featured a fivefold rise in petroleum prices and a staggering increase in the value of Venezuela's petroleum exports, despite declining output. The 1986 plunge in world oil prices was followed by a sustained period of growth in the sector, that lost momentum in 1998.
Crude petroleum (59%) and refined petroleum products (27%) are the main commodity exports of Venezuela, with refined petroleum products accounting for 4.5% of the world's total exports. Other exports include iron and steel (2.7%) and aluminum (2.5%).
In 2000 Venezuela's imports were distributed among the following categories:
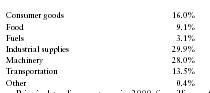
| Consumer goods | 16.0% |
| Food | 9.1% |
| Fuels | 3.1% |
| Industrial supplies | 29.9% |
| Machinery | 28.0% |
| Transportation | 13.5% |
| Other | 0.4% |
Principal trading partners in 2000 (in millions of US dollars) were as follows:
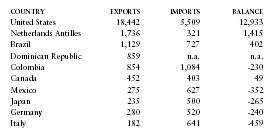
| COUNTRY | EXPORTS | IMPORTS | BALANCE |
| United States | 18,442 | 5,509 | 12,933 |
| Netherlands Antilles | 1,736 | 321 | 1,415 |
| Brazil | 1,129 | 727 | 402 |
| Dominican Republic | 859 | n.a. | n.a. |
| Colombia | 854 | 1,084 | -230 |
| Canada | 452 | 403 | 49 |
| Mexico | 275 | 627 | -352 |
| Japan | 235 | 500 | -265 |
| Germany | 280 | 520 | -240 |
| Italy | 182 | 641 | -459 |
Comment about this article, ask questions, or add new information about this topic: