Uruguay - Foreign trade

Uruguay traditionally relies on foreign sales of wool, hides, and meat products for its export revenues, which increased steadily until 1998, and then dropped off slightly. Export revenues from goods and services annually increased by an average of 3.3% during 1977–87, and by 8.2% between 1988 and 1998. The value of imports fell by an average 1.7% per year during the 1980s, but have increased by an average of 17.1% annually during 1990–95. In 2000, exports increased by 2.6%, and imports rose 3.3%.
Imports have been stimulated by falling tariffs, the ongoing implementation of MERCOSUR agreements, revaluation of the Uruguayan peso, and gradual liberalization of the economy. Rising imports of consumer goods reflect pent-up demand, while increased imports of capital goods reflect the need to upgrade industrial facilities to meet foreign competition. In the first half of 1999, Uruguay's exports declined by 25%. The nation's trade deficit nearly doubled between 1998 and 1999 as a result of the international financial recession.
Uruguay's major commodity exports are meat (19%), leather (9.4%) rice (7.2%), and automobiles (68%). Other exports include dairy products (5.5%) and textile yarn (5.0%)
In 2000, Uruguay's imports were distributed among the following categories: consumer goods, 17.4%; food, 9.0%; fuels, 15.4%; industrial supplies, 31.9%; machinery, 16.0%; and transport, 10.4%.
Trade with Brazil and Argentina accounts for about half of Uruguay's trade. Principal trading partners in 2000 (in millions of US dollars) were as follows:
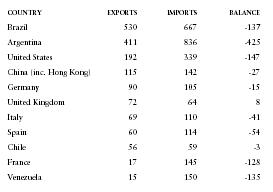
| COUNTRY | EXPORTS | IMPORTS | BALANCE |
| Brazil | 530 | 667 | -137 |
| Argentina | 411 | 836 | -425 |
| United States | 192 | 339 | -147 |
| China (inc. Hong Kong) | 115 | 142 | -27 |
| Germany | 90 | 105 | -15 |
| United Kingdom | 72 | 64 | 8 |
| Italy | 69 | 110 | -41 |
| Spain | 60 | 114 | -54 |
| Chile | 56 | 59 | -3 |
| France | 17 | 145 | -128 |
| Venezuela | 15 | 150 | -135 |