United States - Foreign trade
The foreign trade position of the United States deteriorated in the 1980s as the United States became a debtor nation with a trade deficit that ballooned from $24 billion to over $100 billion by the end of the 1980s; by 1998, the trade deficit had reached an estimated $249 billion. In 2001 exports, consisting of automobiles, industrial supplies and raw materials, consumer goods, and agricultural products, were $998 billion, up from $393.6 billion in 1990. General imports for 2001 were valued at $1.36 trillion, a record high. California led the nation in value of exports originating in the state, followed by Texas and New York.
The United States' imports and exports for 2001 (in millions of US dollars) are distributed among the following categories:
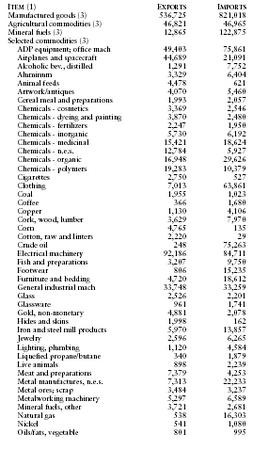
| I TEM (1) | E XPORTS | I MPORTS |
| Manufactured goods (3) | 536,725 | 821,018 |
| Agricultural commodities (3) | 46,821 | 46,965 |
| Mineral fuels (3) | 12,865 | 122,875 |
| Selected commodities (3) | ||
| ADP equipment; office mach | 49,403 | 75,861 |
| Airplanes and spacecraft | 44,689 | 21,091 |
| Alcoholic bev., distilled | 1,291 | 7,752 |
| Aluminum | 3,329 | 6,404 |
| Animal feeds | 4,478 | 621 |
| Artwork/antiques | 4,070 | 5,460 |
| Cereal meal and preparations | 1,993 | 2,057 |
| Chemicals - cosmetics | 3,369 | 2,546 |
| Chemicals - dyeing and painting | 3,870 | 2,480 |
| Chemicals - fertilizers | 2,247 | 1,950 |
| Chemicals - inorganic | 5,730 | 6,192 |
| Chemicals - medicinal | 15,421 | 18,624 |
| Chemicals - n.e.s. | 12,784 | 5,927 |
| Chemicals - organic | 16,948 | 29,626 |
| Chemicals - polymers | 19,283 | 10,379 |
| Cigarettes | 2,750 | 527 |
| Clothing | 7,013 | 63,861 |
| Coal | 1,955 | 1,023 |
| Coffee | 366 | 1,680 |
| Copper | 1,130 | 4,106 |
| Cork, wood, lumber | 3,629 | 7,970 |
| Corn | 4,765 | 135 |
| Cotton, raw and linters | 2,220 | 29 |
| Crude oil | 248 | 75,263 |
| Electrical machinery | 92,186 | 84,711 |
| Fish and preparations | 3,207 | 9,750 |
| Footwear | 806 | 15,235 |
| Furniture and bedding | 4,720 | 18,612 |
| General industrial mach | 33,748 | 33,259 |
| Glass | 2,526 | 2,201 |
| Glassware | 961 | 1,741 |
| Gold, non-monetary | 4,881 | 2,078 |
| Hides and skins | 1,998 | 162 |
| Iron and steel mill products | 5,970 | 13,857 |
| Jewelry | 2,596 | 6,265 |
| Lighting, plumbing | 1,120 | 4,584 |
| Liquefied propane/butane | 340 | 1,879 |
| Live animals | 898 | 2,239 |
| Meat and preparations | 7,379 | 4,253 |
| Metal manufactures, n.e.s. | 7,313 | 22,233 |
| Metal ores; scrap | 3,484 | 3,237 |
| Metalworking machinery | 5,297 | 6,589 |
| Mineral fuels, other | 3,721 | 2,681 |
| Natural gas | 538 | 16,303 |
| Nickel | 541 | 1,080 |
| Oils/fats, vegetable | 801 | 995 |
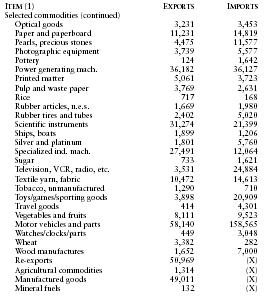
| I TEM (1) | E XPORTS | I MPORTS |
| Selected commodities (continued) | ||
| Optical goods | 3,231 | 3,453 |
| Paper and paperboard | 11,231 | 14,819 |
| Pearls, precious stones | 4,475 | 11,577 |
| Photographic equipment | 3,739 | 5,577 |
| Pottery | 124 | 1,642 |
| Power generating mach. | 36,182 | 36,127 |
| Printed matter | 5,061 | 3,723 |
| Pulp and waste paper | 3,769 | 2,631 |
| Rice | 717 | 168 |
| Rubber articles, n.e.s. | 1,669 | 1,980 |
| Rubber tires and tubes | 2,402 | 5,020 |
| Scientific instruments | 31,274 | 21,399 |
| Ships, boats | 1,899 | 1,206 |
| Silver and platinum | 1,801 | 5,760 |
| Specialized ind. mach. | 27,491 | 12,064 |
| Sugar | 733 | 1,621 |
| Television, VCR, radio, etc. | 3,531 | 24,884 |
| Textile yarn, fabric | 10,472 | 14,613 |
| Tobacco, unmanufactured | 1,290 | 710 |
| Toys/games/sporting goods | 3,898 | 20,909 |
| Travel goods | 414 | 4,301 |
| Vegetables and fruits | 8,111 | 9,523 |
| Motor vehicles and parts | 58,140 | 158,565 |
| Watches/clocks/parts | 449 | 3,048 |
| Wheat | 3,382 | 282 |
| Wood manufactures | 1,652 | 7,000 |
| Re-exports | 50,969 | (X) |
| Agricultural commodities | 1,314 | (X) |
| Manufactured goods | 49,011 | (X) |
| Mineral fuels | 132 | (X) |
| (-) Represents zero or less than one half unit of measurement shown. (X) | ||
| Not applicable. | ||
| (1)Detailed data are presented on a census basis. The information needed | ||
| to convert to a BOP basis is not available. | ||
| (2)Total exports (Domestic and Foreign) | ||
| (3)Domestic exports |
The following 21 nations account for approximately 77% of US imports, and 79% of US goods exports: Argentina, Australia, Belgium, Canada, China (including Hong Kong), Egypt, Germany, France, Italy, Japan, Republic of Korea, Malaysia, Mexico, Netherlands, Saudi Arabia, Singapore, Spain, Switzerland, United Arab Emirates, United Kingdom, and Venezuela.
Principal trading partners in 2000 (in millions of US dollars) were as follows:
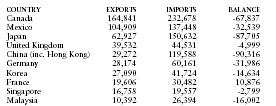
| COUNTRY | EXPORTS | IMPORTS | BALANCE |
| Canada | 164,841 | 232,678 | -67,837 |
| Mexico | 104,909 | 137,448 | -32,539 |
| Japan | 62,927 | 150,632 | -87,705 |
| United Kingdom | 39,532 | 44,531 | -4,999 |
| China (inc. Hong Kong) | 29,272 | 119,588 | -90,316 |
| Germany | 28,174 | 60,161 | -31,986 |
| Korea | 27,090 | 41,724 | -14,634 |
| France | 19,606 | 30,482 | 10,876 |
| Singapore | 16,758 | 19,557 | -2,799 |
| Malaysia | 10,392 | 26,394 | -16,002 |
I'll much appreciate it if yu can provide me with that or show me where I can get it on the Internet. Thank you.