Costa Rica - Foreign trade

Among Costa Rica's major exports are coffee, bananas, sugar, cocoa, and cattle and meat products—all commodities vulnerable to world market prices. The major markets for Costa Rican exports are the US, the UK, Germany, Italy, Guatemala, El Salvador, Honduras, and Belgium.
Imports consist mainly of raw materials for industry and mining, followed by consumer goods and capital goods for industry, mining, and transportation. Major suppliers include the US, Mexico, Venezuela, Japan, Spain, Guatemala, and Germany.
In 1996, falling terms of trade due to lower international prices for coffee, beef, and sugar, and the drop in banana production, caused traditional exports to perform less well than in previous years. However, the growth of non-traditional exports picked up part of the slack, despite some adverse effects from much-enhanced competitiveness of competing Mexican exports. Despite the economic recession, the value of imports of goods increased by 16% in 1996, well above the 8% for the previous year. A major factor was the substantial increase in international fuel prices and a relatively strong local currency. As a result, the trade deficit worsened from 1995 by almost 117% to $76 million.
The value of imports continued to rise into 1998, by after 1997 the value of imports as compared to exports was balanced. Exports in 1999 climbed above imports because of the sale of computer chips, but in 2000 the trade deficit returned.
Costa Rica relied mostly on agriculture to sustain its commodity export market in 1996. Fruits and nuts made up almost a third of exports (30%), and coffee was the second-largest export (15%). Other agricultural exports included non-edible vegetable oils (4.6%), fruit (2.5%), edible vegetables (2.4%), meat (2.0%), and sugar (1.5%). Small amounts of medicines and gold were exported from Costa Rica (2.1% and1.7%).
In 2000 Costa Rica's imports were distributed among the following categories:
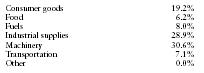
| Consumer goods | 19.2% |
| Food | 6.2% |
| Fuels | 8.0% |
| Industrial supplies | 28.9% |
| Machinery | 30.6% |
| Transportation | 7.1% |
| Other | 0.0% |
Principal trading partners in 2000 (in millions of US dollars) were as follows:
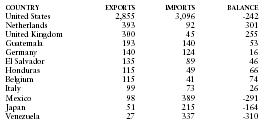
| COUNTRY | EXPORTS | IMPORTS | BALANCE |
| United States | 2,855 | 3,096 | -242 |
| Netherlands | 393 | 92 | 301 |
| United Kingdom | 300 | 45 | 255 |
| Guatemala | 193 | 140 | 53 |
| Germany | 140 | 124 | 16 |
| El Salvador | 135 | 89 | 46 |
| Honduras | 115 | 49 | 66 |
| Belgium | 115 | 41 | 74 |
| Italy | 99 | 73 | 26 |
| Mexico | 98 | 389 | -291 |
| Japan | 51 | 215 | -164 |
| Venezuela | 27 | 337 | -310 |
We appear us, we are two French students, in training course of international trade in Colombia in a company which exports bags of leather craft.
At present, our work consists in looking for the conditions required to export of Colombia towards other countries of Americas among which Costa Rica.
And thus, we would like to know if there are agreements between these 2 countries and the modalities which it is necessary for the customs.
Thank you in advance of all the help that could you bring us.
Sincere greetings,
Xavier BROUILLET , Vincent BAYARD
Limon Piel
Pasto, Colombia
kind regards
Maih Gilbert.