Canada - Balance of payments
Canada's merchandise balances, although fluctuating, showed consistent surpluses between 1961 and 2000, except for 1975. These, however, were offset by persistent deficits from other transactions. Sources of these deficits include Canada's indebtedness to other countries, travel of Canadians abroad, payments for freight and shipping, personal remittances, migrants' transfers, official contributions, and other Canadian government expenditures abroad.
In 2000, Canada recorded a current account surplus of US $12.8 billion, the first such surplus since 1996. Merchandise trade was responsible for most of the improvement, in part due to the then-thriving US economy, which received 86% of Canada's total merchandise exports. Canada at that time received 22% of total US merchandise exports, making it the largest single-country export market for the United States.
The US Central Intelligence Agency (CIA) reports that in 2002 the purchasing power parity of Canada's exports was US $260.5 billion while imports totaled US $229 billion resulting in a trade surplus of US $31.5 billion.
The International Monetary Fund (IMF) reports that in 2001 Canada had exports of goods totaling US $268 billion and imports totaling US $226.5 billion. The services credit totaled US $36.6 billion and debit US $42 billion. The following table summarizes Canada's balance of payments as reported by the IMF for 2001 in millions of US dollars.
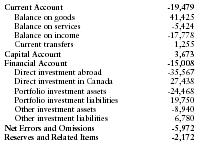
| Current Account | -19,479 |
| Balance on goods | 41,425 |
| Balance on services | -5,424 |
| Balance on income | -17,778 |
| Current transfers | 1,255 |
| Capital Account | 3,673 |
| Financial Account | -15,008 |
| Direct investment abroad | -35,567 |
| Direct investment in Canada | 27,438 |
| Portfolio investment assets | -24,468 |
| Portfolio investment liabilities | 19,750 |
| Other investment assets | -8,940 |
| Other investment liabilities | 6,780 |
| Net Errors and Omissions | -5,972 |
| Reserves and Related Items | -2,172 |
Comment about this article, ask questions, or add new information about this topic: