Brazil - Foreign trade
Brazil's long-favorable foreign-trade balance deteriorated substantially between 1958 and 1974 as a result of industrial expansion, which necessitated increased imports of industrial capital goods and petroleum. During 1975/76 and again from 1978 to 1982, the foreign-trade balance was in deficit. Beginning in 1983, Brazil recorded trade surpluses: $5.1 billion in 1983, $11.8 billion in 1984, and $11.3 billion in 1985. This achievement was the result of policies that restricted imports and offered substantial incentives to exporters.
Between 1963 and 1981, exports expanded at an average annual rate of 17%, but they grew by only 9.1% between 1982 and 1985. Coffee has long been Brazil's dominant export, but the proportion of its export earnings declined from 41.3% in 1968 to3.2% in 2000. As a result of an ambitious energy development program, Brazil's reliance on imported oil dropped from 70% of its needs in 1980 to 45% in 1985.
The notable accomplishment of former President Fernado Collor de Mello to open the Brazilian market remains the cornerstone of Brazil's economic and trade policies. However, after almost 30 years of import substitution, which initially brought high growth and short-term industrialization in the 1960s–1970s, this policy was finally recognized in the late 1980s as the principal culprit of Brazil's economic woes, particularly high inflation and industrial decline.
Over the last few years, most of Brazil's non-tariff barriers to trade, which for many years were the hallmark of Brazil's restrictive trade regime, were eliminated or drastically reduced. Import duties were reduced from an average of about 50% in the late 1980s to 14.2% and a maximum of 35%. While the overall level and pervasiveness of non-tariff barriers have been drastically reduced, some import duties remain high in comparison with other countries. While the depression/inflation problems of recent years have reduced purchasing power by about 50% among the working and lower middle classes and further skewed the already highly uneven distribution of income, the Brazilian market remains enormously attractive to US businesses.
Although trade barriers continued to recede with the government of former President Itamar Franco who assumed office in 1992, trade liberalization lost some of its momentum, and there were serious concerns regarding automobile, telecommunications, and informatics sectors. The reforms gained new momentum under the next President Cardoso's administration.
In 1995, Brazil joined with Argentina, Paraguay, and Uruguay to form the MERCOSUR common market, made up of 200 million people worth over $1 trillion. The agreement covers tariffs for over 85% of some 9,000 items with the remaining 15% to be covered by 2003 and complete coverage to be achieved by 2006. Brazil has an almost symbiotic relationship with Argentina, in which the latter supplies natural gas, automobiles, and other products; while the former exports steel, shoes, and paper products.
In 1999, Argentina implemented trade restrictions on certain Brazilian products because prices were ridiculously low from the currency devaluation. Brazil replied by putting its own trade barriers in place. Such measures did not bode well for the MERCOSUR community. Argentina had been in recession for several years, and its fallout of late 2001 further worsened MERCOSUR's situation. In addition, Brazil has had considerable problems with its electrical distribution system in the past few years, forcing the rationing of electricity and complicating production.
The most popular export commodities from Brazil are road vehicles iron and steel. The country also exports a substantial amount of iron ore, soybeans, meat, and coffee. The top nine exports in 2000 were as follows:
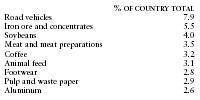
| % OF COUNTRY TOTAL | |
| Road vehicles | 7.9 |
| Iron ore and concentrates | 5.5 |
| Soybeans | 4.0 |
| Meat and meat preparations | 3.5 |
| Coffee | 3.2 |
| Animal feed | 3.1 |
| Footwear | 2.8 |
| Pulp and waste paper | 2.9 |
| Aluminum | 2.6 |
In 2000 Brazil's imports were distributed among the following categories:
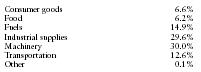
| Consumer goods | 6.6% |
| Food | 6.2% |
| Fuels | 14.9% |
| Industrial supplies | 29.6% |
| Machinery | 30.0% |
| Transportation | 12.6% |
| Other | 0.1% |
Principal trading partners in 2000 (in millions of US dollars) were as follows:
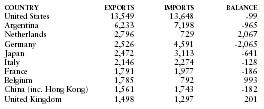
| COUNTRY | EXPORTS | IMPORTS | BALANCE |
| United States | 13,549 | 13,648 | -99 |
| Argentina | 6,233 | 7,198 | -965 |
| Netherlands | 2,796 | 729 | 2,067 |
| Germany | 2,526 | 4,591 | -2,065 |
| Japan | 2,472 | 3,113 | -641 |
| Italy | 2,146 | 2,274 | -128 |
| France | 1,791 | 1,977 | -186 |
| Belgium | 1,785 | 792 | 993 |
| China (inc. Hong Kong) | 1,561 | 1,743 | -182 |
| United Kingdom | 1,498 | 1,297 | 201 |
Love, Mitch and Cade